Table of Contents
Start here
New to MERMAID? Your journey begins here
What is MERMAID?
MERMAID is a science-driven platform developed as an initiative of the Wildlife Conservation Society (WCS). Designed to streamline and enhance coral reef monitoring, data management, and analysis, MERMAID supports practitioners in collecting high-quality ecological data efficiently and consistently.
More than just a data platform, MERMAID fosters a global community of scientists, conservationists, and resource managers working collaboratively to understand, protect, and restore the world’s coral reefs.
What are the MERMAID tools?
MERMAID supports the full coral reef data workflow—from field data collection to visualization and analysis—through a suite of integrated tools:
MERMAID Collect for entering and managing reef survey data.
MERMAID Explore for visualizing and sharing metrics.
MERMAID R package for accessing and analyzing MERMAID data in R.
MERMAID API for developers to build custom workflows and integrations.

How to get started
There are a few things we encourage you to do in order to make the most of what MERMAID has to offer:
Connect and engage
We have a dedicated team to make sure you can get the most out of our technology.
Introduce yourself and let us know more about your goals!
Attend a live regional event. We recommend signing up for our newsletter to learn about upcoming events near you.
Join relevant spaces like our LinkedIn and Facebook pages to share your thoughts, ask questions, and engage in conversations with other members.
Ask questions to get the support you need.
Explore our product and updates
Discover survey data in MERMAID Explore
Create your first project in MERMAID Collect
See what’s recently released from the MERMAID product team. You can also get more details of product releases here.
Give feedback about our product to help us improve it for you and other community members.
Learn with us
Read through this documentation to explore core workflows and features.
Explore video tutorials and webinars designed to upskill your knowledge in MERMAID.
Supercharge your data insights with coral analysis formulas from other members like you in our analysis hub.
Thank you for being part of our community. We look forward to connecting with you and helping you achieve success with MERMAID!
Discover everything you need to get started with MERMAID in this documentation and make the most of this all-in-one coral reef data platform.
How MERMAID works
MERMAID brings you a complete suite of digital tools that work together to streamline and enhance your coral reef data collection, management, and analysis.
MERMAID Collect
Start by creating a project in MERMAID Collect, where you can define your survey sites, assign team members, and enter data using standardized methods for fish, benthic, and bleaching surveys, even offline. MERMAID Collect replaces spreadsheets with a user-friendly interface that guides you through data entry, validation, and submission, ensuring high-quality, ready-to-use datasets.
Visit the documentation for MERMAID Collect.
MERMAID Explore
After submitting your data in MERMAID Collect, use MERMAID Explore to visualize reef health metrics such as fish biomass and benthic cover—ranging from national summaries down to individual sites. MERMAID Explore enables you to browse interactive charts, view project metadata, and export clean data. It also provides access to reef monitoring data from publicly shared projects across the MERMAID community, helping you contextualize your findings within broader regional or global patterns.
Visit the documentation for MERMAID Explore.
MERMAID R package (mermaidr)
For advanced analysis, use the MERMAID R package to access your project data within R. The package provides structured, analysis-ready observations and summary metrics for fish, benthic, and bleaching surveys. Easily generate custom plots, perform statistical modeling, or integrate MERMAID data into larger workflows. With the MERMAID R package, you can also tap into one of the largest global databases of public coral reef data—directly within your reproducible R workflows.
Visit the documentation for the MERMAID R package.
Together, these tools create a streamlined, scientist-first workflow—making it easier to collect consistent data, collaborate with teams, and turn monitoring efforts into insights for conservation and management.

Have questions? Feel free to contact us through the Contact Form. You can also download an offline PDF version of this guide for your convenience.
Quick start guide
Here’s how you can start with MERMAID in a few easy steps
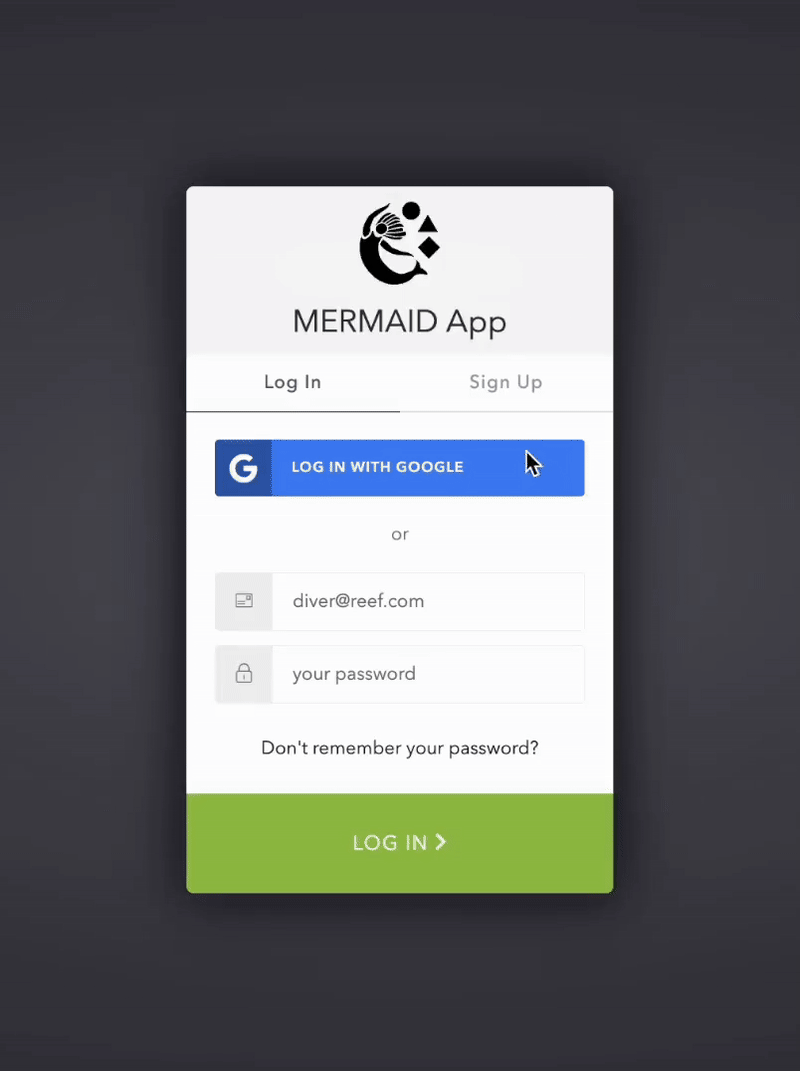
1. Create your MERMAID account
Go to MERMAID Collect at app.datamermaid.org
Click Sign up and choose:
Google login (use your Gmail account), or
Enter an email and password
Verify your email (if not using Google)
You’re ready to start using MERMAID Collect
2. Start your first project in MERMAID Collect
Projects are the digital home for your monitoring surveys
Log in to MERMAID Collect
Click New project (top-right)
Enter a project name and click Create project
3. Set up your project
Add project info → Under ADMIN > Project info, enter description and add organization(s)
Invite team members → Under ADMIN > Users, add emails and assign roles:
Admin – full control
Collector (default) – enter and submit data
Read-only – view/export data only
Set data sharing policies → Under ADMIN > Data sharing, choose for each survey type:
Private – raw and summary data private, metadata visible
Public summary (default) – raw data private, summary data and metadata visible
Public – all data accessible, including raw data
Add sites → Under METADATA > Sites, create new site or copy from other projects
Add management → Under METADATA > Management Regimes, create new management or copy from other projects
4. Collect data in your project
Go to your project’s Collecting page
Click + Add sample unit
Choose survey method:
Fish belt
Benthic PIT / LIT / photo quadrat (manual or AI image classification)
Bleaching
Habitat complexity
Fill out required fields (marked with a red asterisk) such as site, management and date
Enter your observations and get real-time reef health metric summaries (online and offline)
Save progress anytime
When ready, validate and submit → MERMAID automatically checks your data before submission
5. Explore and share your data
Go to MERMAID Explore (explore.datamermaid.org) from your project by clicking the globe icon
Use the advanced filters to visualize reef health metrics like fish biomass and benthic % cover
Share with others by clicking Share this view
Export your data (as spreadsheets) from MERMAID Collect and Explore
6. Analyze and report your data
Use the MERMAID R package (mermaidr) to access and analyze your data (or public data in MERMAID). For full documentation, go to data-mermaid.github.io/mermaidr/
Explore our analysis hub at datamermaid.org/analysis-hub for analysis and reporting templates or submit your own
You can also download our quick start guide and share with your team to kick start the MERMAID journey.
Using MERMAID Collect
Getting started
MERMAID makes it easy to collaborate on coral reef monitoring by giving teams a centralized platform to collect, manage, and start exploring their data. Before your first dive into MERMAID Collect, you’ll need to create an account and start your first project.
Create your MERMAID account
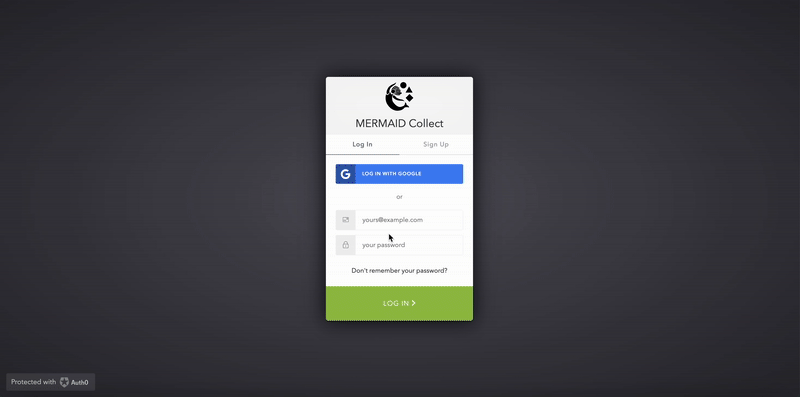
Start by visiting https://app.datamermaid.org and click the Sign up button.
You can register using:
Google login: Connect with your existing Gmail account and password.
Email and password: Use any email to create a MERMAID-specific login.
Your account will be linked to the email you use. After signing up, check your inbox for a confirmation email—click the link to verify and activate your account. If using a Google login, you won’t need to confirm your email.
Note: MERMAID accounts are required to use Collect and interact with data. |
You’ll find your profile settings by clicking your avatar in the upper-right corner of any page. Here, you can view your email address and update your display name. If you use a Google login, your profile picture will be displayed.
Did you forget your password?
If you ever forget your MERMAID password, just click “Don’t remember your password?” on the login screen at app.datamermaid.org to receive a reset email.
Note: If you signed up using Google and forgot your Gmail password, you'll need to reset it directly through Google.
Note: MERMAID Collect works best on Google Chrome, Mozilla Firefox, or Microsoft Edge. Other browsers like Safari and Internet Explorer may not display all features correctly. |
Start by exploring the demo project
The demo project is a ready-to-use test project available from the Projects page in MERMAID Collect. It allows you to explore features, practice workflows, and familiarize yourself with the platform—without creating real project data.

What is the demo project?
The demo project is designed as a safe, interactive space where you can:
Try out data entry workflows (e.g. benthic photo quadrats, fish belt surveys)
Explore project structure and settings (sites, management, users, etc.)
Test features like validations, submissions, and editing
Get comfortable with Collect before creating your own project and working on real data
The available tour of the demo project highlights all key areas from the sidebar that you will work in a real active project.
How to add and delete the demo project
To add the demo project to your workspace at any time:
In the Projects page, from the split button New project, click Add demo project. The demo project has a visible tag DEMO PROJECT that distinguishes this project from a real active project.


To delete the demo project from your workspace at any time:
Within the demo project, go to Project info page and click Delete demo project at the bottom of the page.

Data in the demo project
Any data entered in the demo project:
Will not appear in MERMAID Explore
Is filtered out by default in mermaidr when accessing your projects
This ensures that demo data remains completely separate from real monitoring data.
Key differences from an active project
The demo project behaves like a real project in most ways, with a few important limitations:
No project duplication
You cannot copy the demo project. The copy button in the demo project card is disabled in the Projects page.No user management
You cannot add, remove, or change role of users within the demo project.No visibility in Explore or via the mermaidr
Data from the demo project is not included in Explore and is excluded by default when accessing project data via the mermaidr package in R.
When to use the demo project
Use the demo project when you want to:
Learn how MERMAID Collect works
Train new team members
Test workflows before field surveys
Experiment without impacting real datasets
For any actual monitoring or data collection, you should create a new project instead.
Tip: If you're new to MERMAID, start with the demo project to build confidence before setting up your own project.
Create your first active project
Projects are at the heart of MERMAID. Think of a project as the digital home for all your coral reef surveys—organized by site, date, team, and method. Each survey you collect is tied to a project, so it’s important to set one up before you begin any data entry.
To start, log into MERMAID Collect, and while online, click the top-right New project button.
You’ll need to:
Enter a project name (required)
Click Create project
When you create a project, you’ll be the admin of that project by default. All project details—like your organization, team members, sites, management regimes, and data sharing policies—can be added after creation. Learn more in Setting Up Your Project. You can also edit your project’s name at any time after it’s created, so don’t worry if it changes later.
Note: Projects can only be created when you're connected to the internet. |
How to define a project
How you define a project in MERMAID is flexible and should reflect the structure of your monitoring work and team. Many users define a project as a single expedition or survey campaign, but the optimal setup depends on your specific context.
Here are key considerations when deciding how to structure your project:
Internet connectivity
If you're working in areas with limited or unreliable internet, keep in mind that projects with large volumes of data can be slower to load. Creating smaller projects per survey trip can help ensure smoother performance when collecting or reviewing data, especially in low-bandwidth environments.Team composition and data access
If multiple partner organizations or teams are involved—especially if they are collecting data at the same location but during different times or under separate initiatives—you may wish to define separate projects (e.g., grant-based projects). This helps maintain data privacy and limits access only to those who need it. In MERMAID, users can only view and edit data within the projects to which they have been added.Survey scope and duration
Projects can span a single field trip or extend over multiple years. If your team conducts repeated surveys over time at the same sites under a consistent protocol and with the same collaborators, a long-term project may be appropriate. If surveys differ in methods, collaborators, or objectives, consider setting up a separate project for each point in time to keep datasets distinct and manageable (e.g., one project per monitoring year).
In short, choose a project structure that supports clear collaboration, efficient data entry, and secure data management—tailored to your workflow and goals.
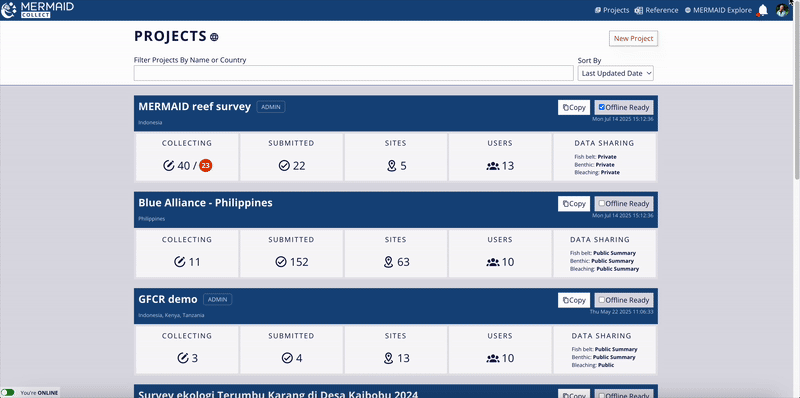
Navigating your project
Once you’ve opened your project in MERMAID Collect, you’ll find everything you need in the sidebar on the left. The sidebar is organized into four main sections: DATA, OVERVIEW, METADATA, and ADMIN. Each section includes tabs that help you manage, collect, and share your project data.
Sidebar overview
Section | Tabs included | What you can do |
DATA | Collecting and Submitted | Enter and review observations as individual sample units. |
OVERVIEW | Sample units / Observers and Sample units / Management regimes | Review sample units and track your team’s progress. |
METADATA | Sites and Management regimes | Manage survey locations and reef management information. |
ADMIN | Project info, Users, and Data sharing | Set up project settings, team, and data privacy. |
What’s shared and what’s private within a project
Each tab in the project sidebar is either shared across all team members or private to you as a contributor—depending on the type of activity.
Shared pages: All information in Submitted, Sites, Management regimes, Project info, Users, and Data sharing pages is visible and editable (based on user role) by everyone in the project team.
Private workspace: The Collecting page is your personal data entry space. Only you can see the sample units you’ve saved here until they are validated and submitted. However, Admins can transfer your sample units to themselves or another user in the same project.
Note: This refers to workspace visibility within a project, not how project data is shared outside the project. You can manage external data access under the Data sharing tab. Learn more in Managing Data Sharing in a Project. |
Setting up a project
Before you dive into collecting data in MERMAID Collect, there are just a few simple things to set up in your project. You’ll add your organization, invite your team, choose how to share your data, and set up your survey sites and management types—so everything is ready to support your work and make collaboration easy.

Step 1: Add project info and organization
Adding more information about your project is a great way to provide additional context and to categorize your surveys so that other users discovering data in MERMAID Explore can better understand your project’s purpose and scope. In addition, adding your organization helps categorize your surveys and makes it easier to search later—both in MERMAID Explore and via the MERMAID R package.
To describe your project and add your organization(s):
Go to Project info under the ADMIN section in your project’s sidebar.
In Notes, enter a description or any detail you’d like to add about your project.
In Organization, Start typing your organization’s name and select it from the dropdown.
If your organization doesn’t appear:
Choose Suggest a new organization to MERMAID
Enter the official name and acronym (e.g., Great Barrier Reef Marine Park Authority (GBRMPA))
Click Send to MERMAID for review. Once sent, it’ll become available in the dropdown list and added to your project.
You can add multiple organizations, one at a time—including partner organizations involved in the project. This helps ensure everyone contributing is properly represented and their work is easily searchable later.
You can also edit your project's name from this page if you need to update or correct it after the initial creation.
Note: Please double-check your spelling before submitting an organization for review. Use the official name, capitalized, followed by the acronym in parentheses. |
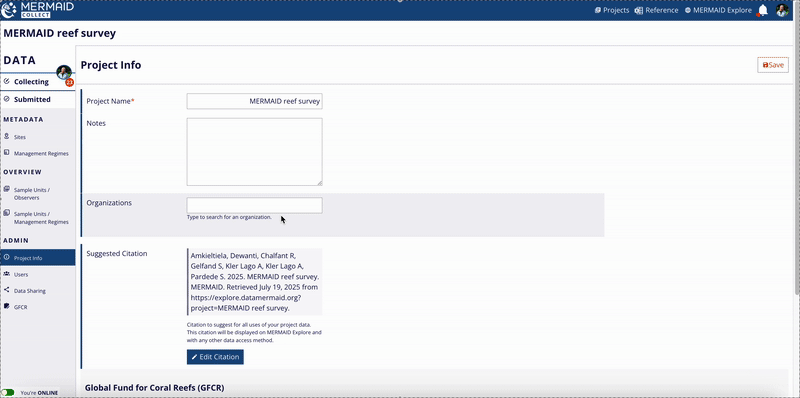
Click Save in the top-right to confirm your updates.
Step 2: Invite users
A project becomes more powerful with collaboration. To invite team members:
Navigate to the Users page under the ADMIN section in your project’s sidebar.
Enter the email address of your user(s) and click +Add user.
Assign a role to each user: Admin, Collector, or Read-only.
Learn more about our user roles and permissions in Adding Team Members to a Project.
Note: Users must have a MERMAID account to interact in the project. If you add someone without an account, they’ll show as (pending user) until they sign up. |

Step 3: Choose the data sharing policies
Deciding how your project data will be shared helps you manage visibility and collaboration within the MERMAID community.
To choose the data sharing policies for your project:
Go to Data sharing under the ADMIN section in your project’s sidebar.
Choose your preferred option for each survey type (Benthic, Fish, and Bleaching): Private, Public summary, or Public.
Learn more about our data sharing policies in Managing Data Sharing in a Project.
You can adjust your data sharing settings any time after creating a project, and you can choose different policies for different survey methods (e.g., private fish vs. public benthic data).

Step 4: Add survey sites
Now it’s time to add the sites where your surveys will take place. Sites are a core part of your survey’s metadata—they define where your observations are collected. Each site represents a geographic location, and it must be added before you can collect any survey data in your project. Adding survey sites can be done online and offline. However, we strongly recommend adding sites while online before heading to the field to ensure that all users have synchronized project data and are working with the most up-to-date site information.
To add sites:
Go to Sites under the METADATA section in your project’s sidebar.
You’ll see two options:
+ New site – Create a brand new site with fresh details.
Copy sites from other projects – Save time by pulling in sites you or other users have used before. You can search sites by name, project, or country.
Read more about sites in Managing Metadata in a Project.

Step 5: Add management regimes for your sites
Management regimes are another key part of your survey’s metadata. They describe the rules or restrictions in place at a site when the survey was conducted—like whether your site is inside a no-take zone or an open-access area. Adding these details helps contextualize your data and enhances its value for analysis and reef management. Similar to adding sites, management regimes can be added online and offline. However, we strongly recommended to add management regimes while online before heading to the field. This step is to ensure that all users can access the most up-to-date management regimes.
To add management regimes:
Go to Management regimes under the METADATA section in your project’s sidebar.
You’ll see two options:
+ New MR – Create a brand new management regime (MR) with fresh details.
Copy MRs from other projects – Save time by pulling in MRs you or other users have used before. You can search MRs by their name, project, or year.
Read more about management regimes in Managing Metadata in a Project.
Is your project for testing or training?
If you’re experimenting or training your team how to use MERMAID Collect, you can use the demo project for this purpose.
The demo project is a ready-to-use test project available from the Projects page in MERMAID Collect. It allows you to explore features, practice workflows, and familiarize yourself with the platform—without creating real project data.
To add the demo project to your workspace at any time:
In the Projects page, from the split button New project, click Add demo project. The demo project has a visible tag DEMO PROJECT that distinguishes this project from a real active project.
To delete the demo project from your workspace at any time:
Within the demo project, go to Project info page and click Delete demo project at the bottom of the page.
Adding team members to a project
MERMAID is built for collaboration. Whether you're collecting data in the field or reviewing surveys back at the office, adding the right team members—and giving them the right level of access—helps ensure a smooth workflow.
To invite users:
Go to the Users page under the ADMIN section in your project’s sidebar.
Enter the email address of each team member and click + Add user.
Assign them a role based on what they’ll be doing in the project: Admin, Collector, or Read-only.
Note: All project users must have a MERMAID account. If you add someone who hasn’t signed up yet, they’ll appear as a (pending user) until they create an account using the same email. |
User roles & permissions
Each role in MERMAID comes with a defined set of permissions that determine what users can and cannot do within a project.
User role | Permissions | Best for |
Admin | Full control of the project:
| Project leads or coordinators. Assign at least two Admins in case one loses access. |
Collector (default) | Data collection-focused permissions:
| Team members entering data or collecting field observations. |
Read-only | View-only access:
| Stakeholders who need insights but not editing rights—like supervisors, partners, or funders. And also good for analysts who need quick access to data for analysis from the project or using the MERMAID R package. |
By default, the person who creates the project is assigned the Admin role. Any users you add afterward will automatically be assigned the Collector role, but you can easily change their role to Admin or Read-only after inviting them—or later at any time.
As an Admin, you can add, remove, or update user roles even after your project is created. If a team member leaves the project or their responsibilities change, you can update their role anytime or remove them through the Users page.
Use this table below to decide which role best fits each team member’s responsibilities.

Managing data sharing in a project
Sharing coral reef data is at the core of MERMAID’s mission—enabling faster, more informed conservation decisions. While your data belongs to you, MERMAID offers flexible sharing options to support collaboration, transparency, and appropriate data stewardship.
You can choose different data sharing policies for each survey method (e.g., private fish data and public benthic data), depending on your organization's needs and data sensitivity. These policies can be updated at any stage of the project–even after data has been submitted–but only users with an Admin role in the project.
The policy you choose for each survey method determines how your data is accessed—whether through MERMAID Explore or via the MERMAID R package in R. Selecting Public or Public summary policies increases visibility and potential impact, while the Private setting ensures that submitted data is visible only to your project team.
To access the data sharing policies:
Go to your project’s Data sharing page under the ADMIN section in the left-hand sidebar.
Choose your preferred policy for each survey type (Benthic, Fish, and Bleaching).
Data sharing policies
MERMAID supports three levels of data sharing, from fully open access (Public) to restricted visibility (Private)—giving you control over how your data is accessed and viewed:
Policy | What’s shared | Best for |
Public | Full access to individual observations, site-level summaries, and project metadata. | Open access and maximum visibility. |
Public summary (default) | Only site-level summaries and project metadata are publicly available. Individual observations remain private. | Sharing general insights while keeping raw data confidential. |
Private | Only project metadata (e.g., project name, survey sites, management regimes) is visible. No submitted data is accessible. | Sensitive or unpublished data not yet ready for release. |
For more details about how each policy governs data access in MERMAID, see table below:

When you create a new project in MERMAID, all survey types (Benthic, Fish, and Bleaching) are set to the Public summary data sharing policy by default. To make changes, go to the Data sharing page in your project and select the appropriate policy for each survey type.
How others access and view your data based on policy
Your selected policy determines how your data is accessed and viewed in both MERMAID Explore and via the MERMAID R package in R.
Policy | Charts & metrics in Explore (benthic % cover, fish biomass, bleaching severity, habitat complexity) | Data export in Explore and access in R |
Public | Yes (site-level summaries) | Project metadata Site-level and transect-level summaries Individual observations |
Public summary | Yes (site-level summaries) | Project metadata Site-level and transect-level summaries No individual observations |
Private | No charts or data available | Project metadata only No submitted data |
Managing metadata in a project
In MERMAID, sites and management regimes are both part of your survey's metadata—providing the essential geographic and contextual information for each observation collected.
You can access Sites and Management regimes from your project’s sidebar under the METADATA section. Admins and Collectors can add or import these elements to get your project ready for data collection.
Adding a new site
Sites define the locations where your survey data is collected—each is anchored by specific coordinates and site-level attributes. Sites can be added both online and offline.
To add a new site:
Go to the Sites tab
Click + New site
You'll need to enter:
Site name
Country
Latitude and Longitude (in Decimal Degrees format)
Tip: Not using Decimal Degrees? Click the i icon next to the coordinate fields to view a tooltip with a helpful link for converting from Degrees Minutes Seconds (DMS) to Decimal Degrees. |
Exposure, Reef type, and Reef zone
As you enter coordinates (latitude and longitude), a red site marker will appear on the map below. You can click and drag the marker to adjust its position if necessary—MERMAID will automatically update the latitude and longitude fields to match the new location.
If you don’t have coordinates handy, you can also place the site directly using the map. Just click Place site marker and click the exact location of your site on the map. You can also click and drag the marker to your desired location. MERMAID will automatically update the latitude and longitude fields to match the location on the map.
The map is integrated with the Allen Coral Atlas, so you can view your site in context using high-resolution Benthic and Geomorphic layer options available directly on the map interface. This makes it easier to visually confirm your site’s habitat type and surrounding features.
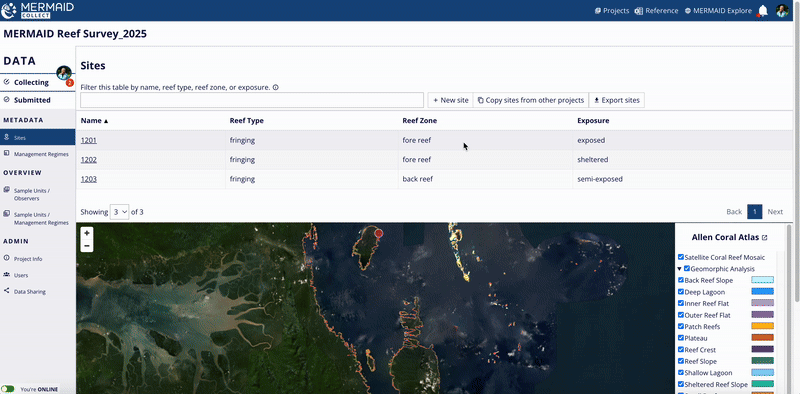
Once all required fields are completed, the Save button will become active. Click Save.
Sites added by one user are automatically available in the whole project, can be seen by all project users in the Sites page once synced online, and can be used when collecting data online and offline.
You can also delete your new site by clicking Delete site on the bottom of the page. Only when saved, can it be deleted, and only by users with an Admin role in the project.
Best practice: Add all planned survey sites before going into the field to avoid duplication and simplify team workflows. |
Reusing sites from other projects
To import sites you or other users have used in other projects:
Click Copy sites from other projects
Filter by site name, project, or country
Select one or more sites and click Copy selected sites to project
You can also check View selected only to view all sites you’ve selected across multiple pages

How to solve duplicate sites in a project
Sometimes, two users may create sites with similar names and coordinates (i.e., 100 meters apart)—especially when working offline. MERMAID detects these as duplicate sites, but only after:
At least one sample unit (e.g., transect or quadrat collection) has been submitted with one of sites, and
Another user is validating a sample unit with another site that matches that in a submitted sample unit.
What happens during validation
When validating a sample unit with a potential duplicate site, you’ll see the following warning message:
“Site: Similar records detected”
Click Resolve to open a comparison pop-up, where you can:
View the duplicate sites side-by-side
Original site (used in the current sample unit) appears on the left.
Duplicate site (already submitted in another sample unit) appears highlighted in yellow on the right.
Choose how to resolve the duplication
You have three options:
Keep both sites
Click Keep both in the bottom-right corner. Both sites will remain in MERMAID as separate entries.Merge sites (keep one)
Click Keep site under the one you want to retain, then confirm by clicking Merge.All sample units linked to the discarded site will automatically be updated to use the kept site.
The discarded site will be removed from the Sites page.
No data is lost—only the site reference is updated.
Edit one of the sites
Click Edit site to change the name and/or coordinates of the selected site. Once changes have been saved, return to your sample unit to revalidate in the Collecting page. Unique sites must have different coordinates.
Adding a new management regime
Management regimes provide context about the governance or protection status of your survey sites. This includes Marine Protected Areas (MPAs), Other Effective Conservation Measures (OECMs), or Open Access areas. Management regimes can be added both online and offline.
To add one:
Go to the Management regimes tab
Click + New MR
Enter at least:
A Name
One Rule (e.g., gear restriction, no-take). “Open Access” is the default.
You can optionally add notes or details like management parties, or compliance.
Once all required fields are completed, the Save button will become active. Click Save.

Management regimes added by one user are automatically available in the whole project, can be seen by all project users in the Management regimes page once synced online, and can be used when collecting data both online and offline.
You can also delete your new management regime by clicking Delete MR on the bottom of the page. Note that only saved management regimes can be deleted, and only by users with an Admin role in the project.
Best practice: Add all management regimes associated with your survey sites before going into the field to avoid duplication and simplify team workflows.
Reusing management regimes from other projects
To avoid retyping:
Click Copy MRs from other projects
Filter by name, project, or year
Select one or more and click Copy selected MRs to project

How to solve duplicate management regimes in a project
Sometimes, users may unintentionally create management regimes with the same name—especially when working offline. MERMAID detects these as duplicate management regimes, but only after:
At least one sample unit (e.g., transect or quadrat collection) has been submitted with one of the management regimes, and
Another user is validating a sample unit with another site that matches that management regime in a submitted sample unit.
What happens during validation
If a management regime with a similar name already exists, you’ll see this warning:
“Another Management Regime is similar to this one”
Click Resolve to open a comparison pop-up, where you can:
Review the duplicate management regimes side-by-side
Original MR (used in the current sample unit) appears on the left.
Duplicate MR (already submitted in another sample unit) appears highlighted in yellow on the right.
Choose how to resolve the duplication
You have two options:
Keep both management regimes
Click Keep both in the bottom-right corner. Both management regimes will remain in MERMAID as separate entries.Merge management regimes (keep one)
Click Keep MR under the one you want to retain (i.e., Original MR or Duplicate MR), then confirm by clicking Merge.All sample units and site metadata referencing the other regime will be updated automatically to use the kept regime.
The duplicate regime will be removed from the Management Regimes page.
No data is lost—only the regime reference is updated.
Edit one of the management regimes
Click Edit MR to revise the name or information added so it is clearly distinct. Unique management regimes must have different names.This is useful when two regimes share a name but represent different management types.
Once edited and saved, return to your sample unit to revalidate in the Collecting page.

Updating sites and management regimes
You can update the details of any site or management regime in your project at any time—including after data has been submitted.
What happens when you update a site or management regime
If you change a site's name, coordinates, or any attributes, or update a management regime’s name or rules:
Changes apply to both unsubmitted and submitted sample units.
The updates will appear throughout MERMAID:
In Collect, so your team sees the most up-to-date information when entering new data or viewing submitted data.
In Explore, so viewed and shared data reflects the current site and management regime information.
In Exports and the MERMAID R package, ensuring consistency across data access points.
This means you don’t need to manually update individual sample units—MERMAID automatically applies these updates for you.
How to update a site or management regime
Go to the Sites or Management regimes page from your project’s sidebar under the METADATA section.
Click on the site or management regime you want to update.
Edit the relevant fields (e.g., name, latitude/longitude, rules).
Click Save to apply your changes.
That’s it—your updates will automatically sync across your project.
Exporting sites or management regimes
You can easily export a list of all sites and management regimes in your project. This feature is especially helpful when preparing for fieldwork or sharing surveys metadata with collaborators.
To export:
Navigate to the Sites or Management regimes page under the METADATA section.
Click the Export sites or Export MRs button in the top-right corner in their respective pages.
This will download a CSV file containing a list of all sites or management regimes and associated information.
Why export sites
Exporting your sites allows you to:
Double-check that all site names, coordinates, and characteristics are correct before heading to the field.
Bring printed or digital references for validation during surveys.
Share official site lists with your team or partners for coordinated data collection.
Add your sites coordinates to your GPS for your field surveys.
Why export management regimes
Exporting your management regimes ensures:
You have a reference for the rules and statuses in effect at each site on the survey date.
Partners and stakeholders can review management designations for shared analysis or reporting.
Deleting sites or management regimes
To delete saved sites or management regimes at any time:
Go to the Sites or Management regimes page under the METADATA section.
Click on the item you want to delete.
Scroll to the bottom and click Delete site or Delete management regime.
Note: Only a user with an Admin role can delete a saved site or management regime in a project. |
If a site or management regime has already been used in a submitted sample unit, you won’t be able to delete it until the sample unit(s) is updated to use a different site or management regime.
If you're not a project admin, you’ll need to:
Ask a project admin to update the site or management regime in the sample unit(s) for you, or
Request that the admin transfers the submitted sample unit back to your Collecting page so you can make the changes yourself.
Learn how to transfer sample units in the Editing Data section.
Using MERMAID Collect offline
If you’re working in a remote location or anywhere without reliable internet, MERMAID has you covered. With offline mode, you can enter data in MERMAID Collect just like you would in Excel—no internet needed. Your project, sites, and management regimes will be fully available and ready to use in the field.
Getting ready to collect data without internet
There are a few important things to do while you're still online. These steps will sync your project and make sure you and your team can collect data offline without any disruptions. Make sure to follow these steps before going offline.
What to do before going to the field
1. Set up your project
While online, make sure your project is created and includes:
All team members who will collect data
All survey sites
All relevant management regimes
Tip: You can add or copy sites and management regimes in advance to make sure everything is ready before going offline, and to avoid users creating duplicate sites or management regimes. |
2. Add your team to the project
Only project Admins can add users. Double-check that:
Everyone who will collect data has been added to the project
They are assigned the Collector role
They appear under the Users tab with their name visible (not listed as “pending user”)
Important: If someone appears as a “pending user,” it means they haven’t created or finished creating their account. Make sure they sign up at app.datamermaid.org, complete the setup, and verify their email address (if the user does not use a Google account). |
3. Mark the project as offline ready
On the Projects page:
Find the project you want to use offline
Ensure that there’s a checkmark next to Offline ready. The Offline ready box is checked by default when a project is created
If it’s not checked, click Offline ready to sync the project for offline access

4. Test offline mode
Make sure everything works before you go:
In MERMAID Collect, click the You're ONLINE toggle (bottom left)
It should change to You're OFFLINE with a red border around the screen
Turn off your Wi-Fi or disconnect from the internet, but do not log out from your MERMAID account
Restart Google Chrome
Open app.datamermaid.org and enter some test data in your Collecting page
If you can see the project and enter data, you're ready!
5. Confirm your team is ready too
Each team member should:
Log in to MERMAID Collect while online
Confirm they can see the project, sites, and management regimes
Switch to You're OFFLINE and verify access
Once all steps are completed, your project is synced and your team is ready to collect data offline.
Important:
|
Dive sheets for field data collection
To make underwater data collection easier and aligned with MERMAID’s digital workflow, we’ve created printable dive sheet templates for each supported survey method.
These dive sheets are designed to help you record observations in the field using the exact structure and fields you’ll see when collecting data in MERMAID Collect.
Each dive sheet matches the metadata and observations required by MERMAID’s data entry forms—so transferring data from your dive sheets to the platform is fast, accurate, and seamless.
These templates are especially helpful when collecting data offline in remote locations. For the Benthic Photo Quadrat method, it is recommended to fill in the metadata before going underwater and take a photo of the filled dive sheet before taking your underwater photos. Once back online, simply transcribe your dive sheet notes into MERMAID Collect to validate and submit your data.
Download the dive sheet template for each method below. You can print and laminate them for repeated field use, or print them directly on waterproof paper for single use.
Collecting data
How data collection works
Collecting accurate, high-quality coral reef data is simple and efficient with MERMAID Collect. Whether you're online or working offline in the field, you can enter observations directly into the platform—no spreadsheets needed.
Data collection begins in your project’s Collecting page. This is your personal workspace where you can enter, view, and edit data from your dive sheets. Species names are searchable with just a few keystrokes, and real-time metrics—such as benthic cover, fish biomass, bleaching severity, and habitat complexity—are automatically calculated as you go, even offline.
Before submission, MERMAID runs built-in validation checks to flag missing or inconsistent values, helping you avoid common data entry errors. Once validated and submitted, your data is ready for analysis and sharing.
Review key terms here used in the data collection before starting.
Start collecting observations
See the step-by-step guide below on how to collect data in your Collecting page.

Step 1: Add a new sample unit
A sample unit is the equivalent of a transect or a quadrat collection on a specific date and site. To record new data, add a sample unit by choosing the appropriate survey method. MERMAID supports six commonly used methods (Read more in Supported Survey Methods), each with tailored data entry forms:
Fish belt transect
Benthic point-intercept transect (PIT)
Benthic line-intercept transect (LIT)
Benthic photo quadrat with manual entry or using the AI image classification (beta).
Bleaching rapid assessment
Habitat complexity visual scoring
You can classify benthic photo quadrats directly in MERMAID using the AI image classification model (beta). Read more about it here.
Step 2: Complete your sample unit form
Fill in the required fields and add your observations in the form for the selected survey method. You can save your progress anytime—even offline.
Complete all required fields (marked with a red asterisk) in the sections Sample event and Transect/Quadrat collection.
Select at least one Observer from the list of project users. Click their name to assign; click again to remove. You can select more than one observer if needed.
Enter all observations in the Observations table.
Click Save to store the sample unit—this works both online and offline. If the Save button is greyed out, no changes have been made since the last save.
Step 3: Validate and submit your sample unit
When you are online and ready to share your data with your project members:
Validate your sample unit. MERMAID will check for errors and warnings.
Fix any errors (which prevent submission) and review warnings (which you can choose to address or ignore).
Submit the sample unit once it passes validation.
Important: You can only delete a sample unit before submitting it. To delete:
Deleted records cannot be recovered. Only an Admin can make edits to a submitted sample unit. For more information on user permissions, read more in Adding Team Members to a Project. |
Step 4: What happens after submission?
Once submitted, your data:
Moves to the Submitted page, where it is visible to all project members.
Is included in project export files (.xlsx format) and can be exported in the Submitted page.
Becomes accessible via the authenticated MERMAID R package.
Is visible and can be exported in MERMAID Explore if your project’s data sharing policy for that survey method is set to Public or Public summary. If Private, data is only visible to you and other project users via an authenticated login in MERMAID Explore.
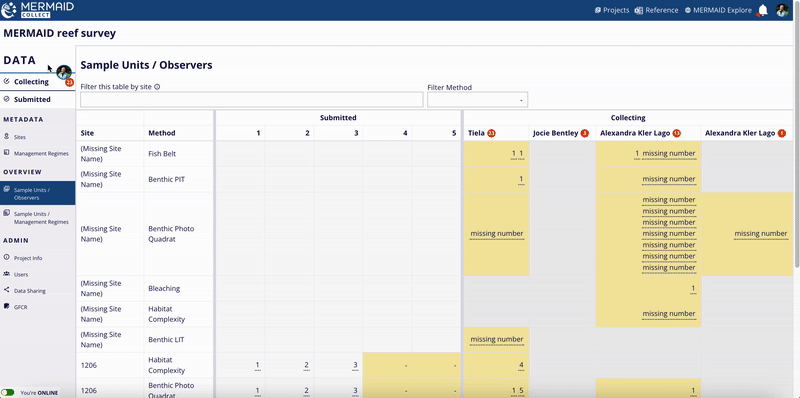
Navigating the Collecting page
The Collecting page is where you enter, view, and edit sample units before they are submitted. Here’s how to use it:
Go to your project’s Collecting page. You can access it by either:
Clicking on Collecting in your project’s sidebar, or
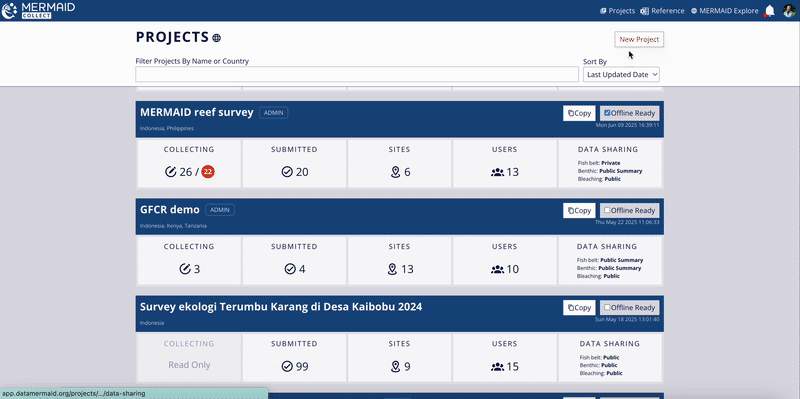
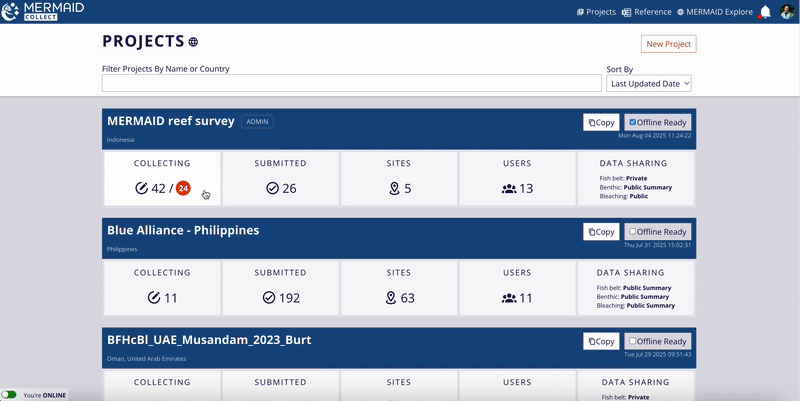
Clicking on Collecting in your project’s card in the Projects page. The Collecting tab in a project card displays two numbers separated by a slash.
Before the slash: The total number of unsubmitted sample units across the entire project.
After the slash (in a red circle): The number of unsubmitted sample units assigned to you in your Collecting page.
In your project's Collecting page, the number in a red circle shows how many sample units you’ve saved but not yet submitted.
Use the search bar or filters to quickly find sample units by method, site, management regime, or observer.
Click any column header to sort entries by that field. You can sort based on multiple fields.
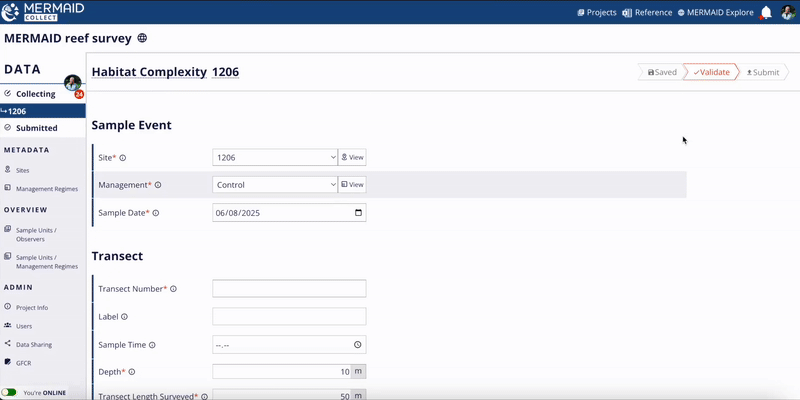
Each sample unit in the list also displays a status column that helps you track your progress and identify what action is needed next:
Saved – The sample unit has been saved but not yet validated.
Errors – Validation failed due to error(s). Issues must be fixed before submission (e.g., missing required fields).
Warnings – Validated with unresolved warning(s). Some fields may need review or be ignored before submission.
Ready to submit – The sample unit has passed validation and can be submitted.
This makes it easy to monitor your work progress and manage what’s complete and what still needs attention.

Only users with the Collector or Admin role can enter and submit data. Read-only users cannot collect data and do not have access to the Collecting page.
MERMAID Collect on mobiles or tablets
MERMAID Collect works seamlessly on your phone or tablet—perfect for data entry between dives while on the boat or in remote locations.
There's no need for an app download: simply open your browser (i.e., Google Chrome, Mozilla Firefox, or Microsoft Edge) and go to app.datamermaid.org. The mobile and tablet interface works just like it does on a computer—allowing you to record observations quickly and reliably in the field.

Key terms to know for collecting data
Term | Definition |
Site | A unique survey location in a project defined by latitude, longitude, name, and other reef characteristics. |
Management regime | A set of rules governing a site at the time of survey (i.e., no-take zone, partial restrictions, or open access). |
Sample event | A collection of sample units using a unique combination of site, date, and management regime—used to group observations for analysis. |
Sample unit | A collection of observations from a single method at a given site on a specific date (e.g., one fish belt transect). |
Observation | A single data point within a sample unit (e.g., a coral genus at 30 cm on a transect). |
Benthic attribute | A benthic observation that can be either a top-level benthic group (e.g., hard coral) or a specific coral genus or species (e.g., Acropora tenuis). |
Validation | Automated checks to ensure completeness and consistency of each sample unit before submission. |
Error | A required value is missing or invalid (e.g., missing transect length). Must be fixed before submission. |
Warning | A potentially unusual value (e.g., very large fish size). Can be reviewed and either corrected or ignored before submission. |
Supported survey methods
MERMAID Collect supports six widely used coral reef survey methods—each with its own built-in data entry form designed to match how you collect data in the field. Whether you're recording fish biomass, benthic cover, or bleaching severity, MERMAID makes it easy to enter structured, high-quality observations directly into the platform.
Types of survey methods supported for data collection
You can enter data for any of the following methods in MERMAID—online or offline—and get automated built-in validation and real-time reef health metrics. Read more in Learning About Our Reef Health Metrics.
Survey method | Description | Supports | Metric summaries | Links to resources |
Fish belt | Collection of individual fish count per size class by species (or genus, family) along a belt transect with a fixed belt width. | Fish name, count and size data entry and real-time biomass and abundance calculations. | Fish biomass (kg/ha) and abundance (individuals) at three levels—total, by trophic group, and by family—using Bayesian length-weight relationships. | Method described in: Ahmadia et al. 2013 |
Benthic point-intercept transect (PIT) | Collection of benthic attributes at a fixed interval (e.g., every 0.1 m or 0.5 m) along a transect line. | Point-based benthic data entry and real-time percent cover calculations and attribute classification. | Percent cover of top-level benthic groups. | Method described in: Ahmadia et al. 2013 |
Benthic line-intercept transect (LIT) | Collection of continuous benthic attributes and their lengths (cm) as they appear along a transect. | Segment-based benthic data entry and real-time percent cover calculations and attribute classification. | Percent cover of top-level benthic groups. | Method described in: Loya and Slobodkin 1971, Loya 1972 |
Benthic photo quadrat | Collection of a set of point-based observations identified per photo quadrat (e.g., 1 m²) taken at a fixed interval (m) along a transect. | Photo upload and storage, point-based benthic data entry and AI-powered Image Classification (Beta). You can choose:
| Percent cover of top-level benthic groups. | Method described in: Preskitt et al. 2004 |
Bleaching (rapid survey) | Haphazard quadrat collection to record coral colony counts by genus and bleaching severity category (i.e., normal, pale, 0-20% bleached, 21-50% bleached, 51-80% bleached, 80-100% bleached, and recently dead), and estimate benthic cover of key groups (i.e., hard coral, soft coral, macroalgae). | Entry of colony count per coral genus per bleaching severity category, and benthic percent cover entry. Also real-time average bleaching severity and benthic percent cover calculations. | Bleaching severity by coral genus and percent cover of key benthic groups. | Method described in: Mc Clanahan et al. 2004, Mc Clanahan and Darling Watch video tutorial here |
Habitat complexity (visual scoring) | Collection of individual scores of habitat complexity for each survey area along a transect using a visual scoring from 0 to 5 (i..e, 0 = no vertical relief, 1 = low and sparse relief, 2 = low but widespread relief, 3 = moderately complex, 4 = very complex with numerous fissures and caves, 5 = exceptionally complex with numerous caves and overhangs). | 6-point scoring scale data entry and average habitat complexity calculation.. | Average habitat complexity (rugosity). | Method described in: Wilson et al. 2007, Darling et al. 2017 |
Each method in MERMAID is backed by published protocols and aligns with global coral reef monitoring standards. Built-in helper text and info icons throughout each sample unit form provide guidance and definitions to help you complete each form with accuracy.
Not seeing a survey method you use?
MERMAID is always evolving. If you use a coral reef survey method that’s not currently supported, let us know! We welcome new method suggestions. Send us a message here.
Need dive sheets for the field?
Download printable dive sheet templates for each survey method on the Dive Sheets for Field Data Collection page. Perfect for underwater use and easy data entry in MERMAID Collect.
Adding a sample unit to collect data
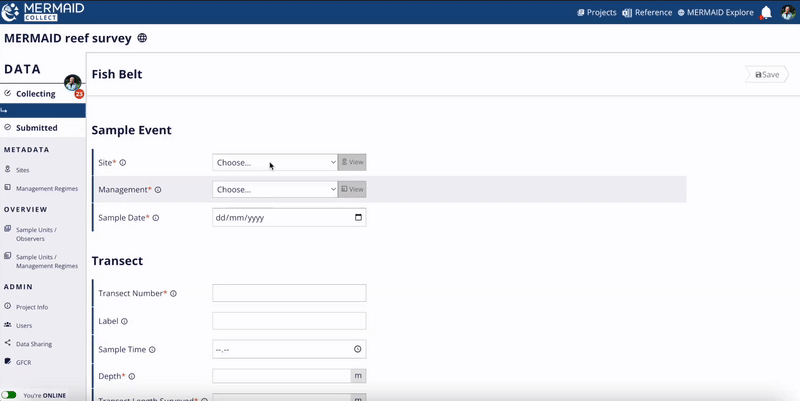
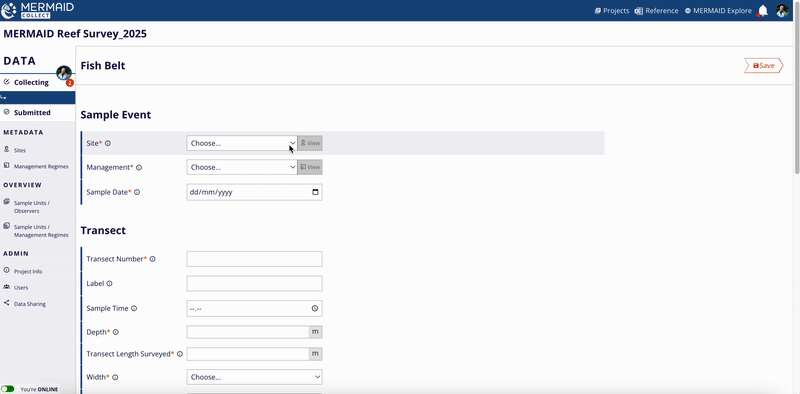
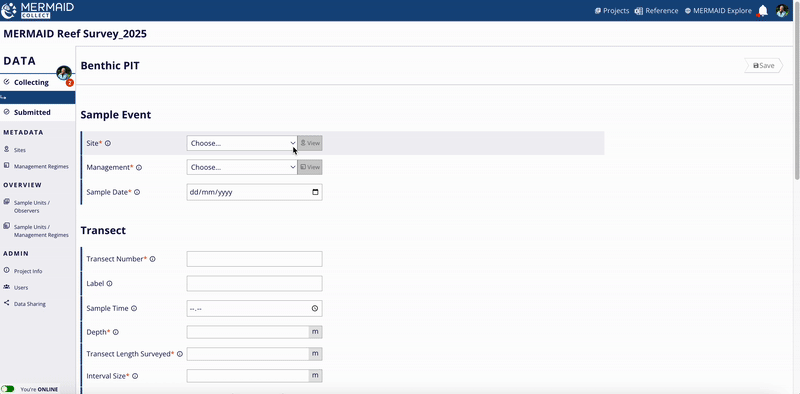
In MERMAID, each transect or quadrat collection you complete in the field—whether it's a fish belt, benthic PIT, or a bleaching rapid assessment—is recorded in the platform as a sample unit. A sample unit represents one instance of data collection using a specific survey method at a specific site on a specific date. It’s the building block of your project dataset in MERMAID.
Filling out a sample unit form
When you’re ready to enter data from your dive sheets, go to your project’s Collecting page and click + Add sample unit. You’ll then select the appropriate method and fill out a structured form organized into four consistent sections (Sample event, Transect/Quadrat collection, Observers, Observations).
Note: Required fields are marked with a red asterisk (*). These include site, management regime, observers, and key transect attributes. Optional fields include time, visibility, current, tide, and notes. Helper text is available for every field—just click the info icon next to a label to view tips, definitions, and example entries. |
1. Sample event
This section defines where and when the data was collected. You'll select:
Site – From the list of sites added to the project. Learn more about adding sites here.
Management regime – From the list of management regimes added to the project. Learn more about adding regimes here.
Date of survey – The date the sample unit was collected.
Each sample event (site, management regime, and date) is used to group your sample units for the reef health metrics calculations in MERMAID. Read more in Learning about Our Reef Health Metrics.

2. Transect/Quadrat collection
This section captures the protocol-specific details of the survey method used. Every method has tailored fields, such as:
Survey method | Protocol-specific fields |
Fish belt | Transect length surveyed (m) Belt width (m) Fish size bin (cm) |
Benthic PIT | Transect length surveyed (m) Interval size (m) Interval start (m) |
Benthic LIT | Transect length surveyed (m) |
Benthic photo quadrat | Quadrat number start Quadrat size (m2) Number of quadrats Number of points per quadrat |
Bleaching | Quadrat size (m2) |
Habitat complexity | Transect length surveyed (m) Interval size (m) |
You’ll also enter general information like:
Transect number
Depth (m)
Optional context – Label, sample time, reef slope, visibility, current, relative depth, tide, notes
Some fields use dropdowns with standardized values (e.g., belt width, fish size bins); others are free text or numeric fields for flexibility (e.g., transect length surveyed, interval size).
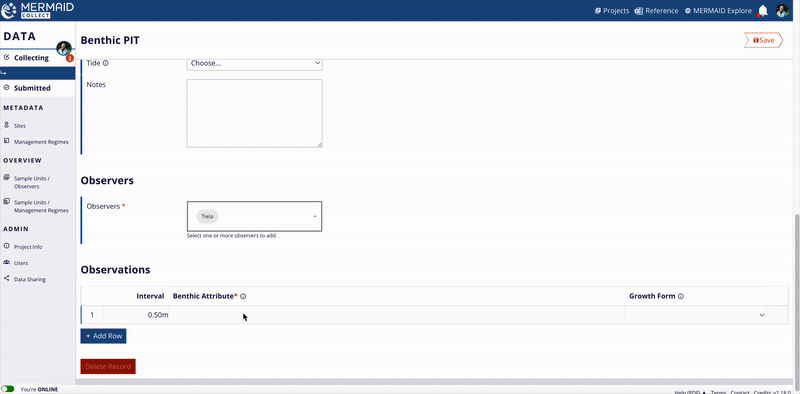
3. Observers
In this section, assign the person(s) who collected the observations underwater:
Select from the list of project users
Click to add or remove names
At least one observer is required per sample unit
Accurate attribution helps with training, reporting, and quality assurance.
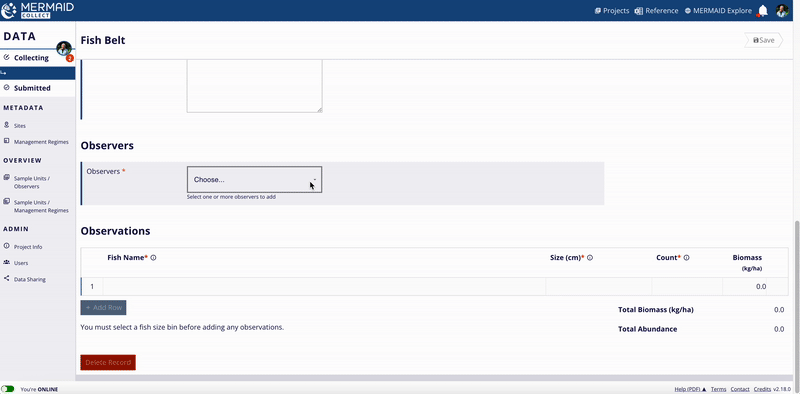
4. Observations
Here’s where you enter your actual data (raw observations):
For Fish belt: fish name, size (cm), count
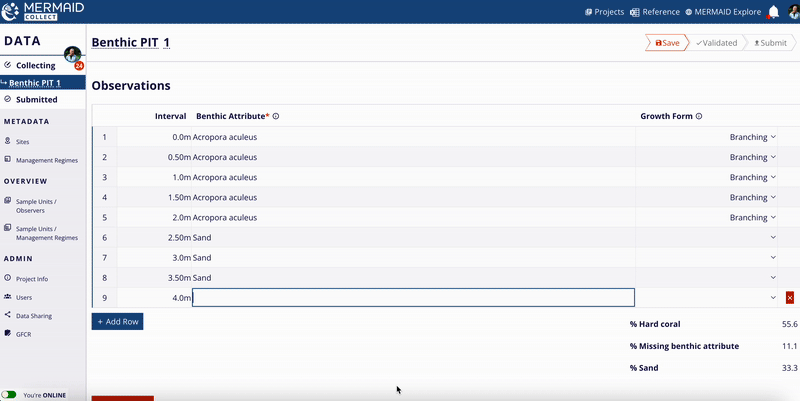
For Benthic PIT: attribute name and growth form (if applicable) per interval (m)
For Benthic LIT: attribute name, growth form (if applicable) and length (cm)
For Benthic photo quadrat: quadrat number, attribute name, growth form (if applicable) and number of points
For Bleaching: coral genus, bleaching severity
For Habitat complexity: habitat complexity score per interval (m)
Suggesting a new benthic attribute or fish species
While entering your observations, if there is a benthic attribute or fish species that isn’t yet listed in the dropdown, you can propose a new one directly while entering observations in the Observations table.
To propose a new benthic attribute:
Type the new benthic attribute in the Observations table, and select Propose new benthic attribute… from the dropdown.
Enter the coral genus/family/top-level category in Parent and the species/genus in Name.
Click Next to review your suggestion.
Click Send to MERMAID to submit it for review.
To propose a new fish species:
Type the new fish species in the Observations table, and select Propose new species… from the dropdown.
Select a Genus name from the dropdown and enter the Species name.
Click Next to review your suggestion.
Click Send to MERMAID to submit it for review.
If the genus you’re trying to add isn’t found in MERMAID’s taxonomic reference, select Contact us for help from the dropdown to notify the MERMAID Team.
Before suggesting a new benthic attribute or fish species to MERMAID, please verify that the species is officially recognized in the World Register of Marine Species (WoRMS). This helps ensure consistency and accuracy in our database.
Once you’ve sent your suggestion for review, it is immediately added to your sample unit as a provisional observation and it will be available to all users. However, it becomes an official part of MERMAID’s taxonomic reference only after it has been reviewed and approved by the MERMAID Team. Once approved, it will be included in the biomass calculation.
You can view the full list of available benthic attributes and fish species by clicking the Reference icon at the top of any page in MERMAID Collect. This will download an up-to-date MERMAID taxonomic reference file.
Viewing metric summaries in a sample unit
As you enter observations in a sample unit, MERMAID automatically calculates and displays key metric summaries to provide quick insights and support data quality checks — all available even when you’re offline.
Read more in Learning About Our Taxonomic Reference.
Explore the metric summaries available for each survey type below:
Fish Belt
For fish belts, total biomass (kg per hectare), using length-weight coefficients from FishBase (Bayesian estimates), and abundance (total count of individuals) are calculated in real-time . These are applied automatically to your fish name, size, and count entries based on the survey area (i.e., transect length and width). MERMAID uses standardized fish taxonomy from the World Register of Marine Species (WoRMS) to ensure consistency.
Note: If you are not seeing biomass estimates beneath the Observations table, make sure both the transect length and belt width are entered in the Transect Details section—these are required to calculate biomass per area. |
Benthic PIT, LIT, and Photo Quadrat
For all benthic methods, percent cover is automatically calculated for each top-level benthic category (e.g., hard coral, soft coral, macroalgae) based on the observations you enter. These percentages are displayed beneath the Observations table. Each benthic attribute entered is hierarchically grouped into these broader categories commonly used in global reef monitoring.
Bleaching
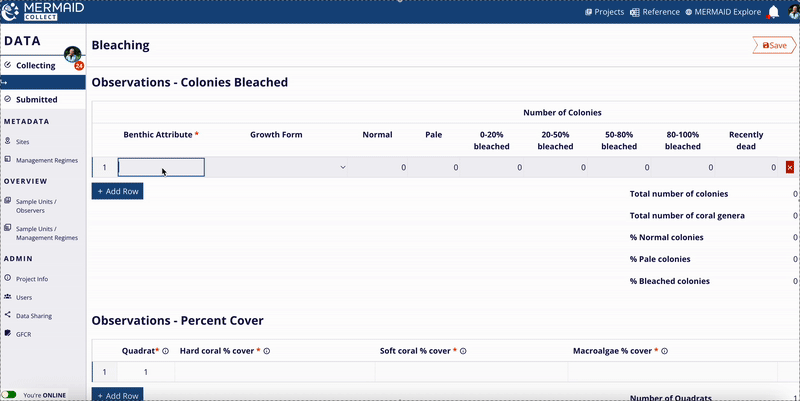
For bleaching surveys, MERMAID calculates:
Total number of coral colonies
Total number of coral genera
Percent colonies by bleaching severity level (normal, pale, and bleached)
Percent cover of hard coral, soft coral, and macroalgae
These metrics appear below the Observations table and help you evaluate the extent of bleaching in real time.
Habitat Complexity
For habitat complexity surveys, MERMAID calculates the average complexity score (scale 0–5) across all intervals entered. This provides an immediate overview of structural habitat condition for each transect.
Saving a sample unit
Saving your work regularly is essential while collecting data in MERMAID Collect. Whether you're online or offline, all sample units are saved locally to your computer to ensure nothing is lost.
Here’s how saving works:
When you enter new information into a sample unit, the Save button in the upper-right corner will turn bright red.
Click the red Save button to save your progress.
Once saved, the button will turn gray and display the label Saved, indicating there is no new data to save.
You can always return to any saved sample unit later to add or change data, then save again.
Automatic prompts for unsaved data
If you try to navigate away from a page with unsaved changes:
MERMAID will show a warning message that you have unsaved data.
Select Cancel to remain on the page and save.
Select OK to leave the page without saving your recent changes.
Tips for data entry: Keyboard shortcuts and predictive text
Use these keyboard shortcuts and the predictive text to move quickly through the Observations table in a sample unit form:
Use the Tab key to move across fields in a row.
Use the Up and Down arrow keys to scroll through benthic attribute or fish name suggestions.
Under the column Fish name, Benthic attribute and Growth form, type a few letters of your observation (e.g., Istpla for Istiophorus platypterus), then use the arrow keys and Enter/Tab to select it from the matching dropdown options. Or type until there’s only one option and press Enter/Return.
Press Tab at the end of a row to duplicate the last observation in the next row—useful for entering different size bins for the same fish species, or entering consecutive observations of the same benthic attribute in a transect.
Press Enter/Return at the end of the row to start a new one and begin typing the next observation.
This helps ensure consistent naming and speeds up your workflow—especially when entering lots of observations.
Collecting fish data
When you're ready to enter your fish observations from your dive sheets, navigate to your project's Collecting page and click + Add sample unit. Choose the Fish Belt method to open a sample unit form organized into four main sections: Sample event, Transect, Observers, Observations.
Read more about our fish belt method in Supported Survey Methods.

Completing a fish belt sample unit form
Note: Required fields are marked with a red asterisk (*). These include site, management regime, observers, and key transect attributes. Optional fields include time, visibility, current, tide, and notes. Helper text is available for every field—just click the info icon next to a label to view tips, definitions, and example entries. |
1. Sample event
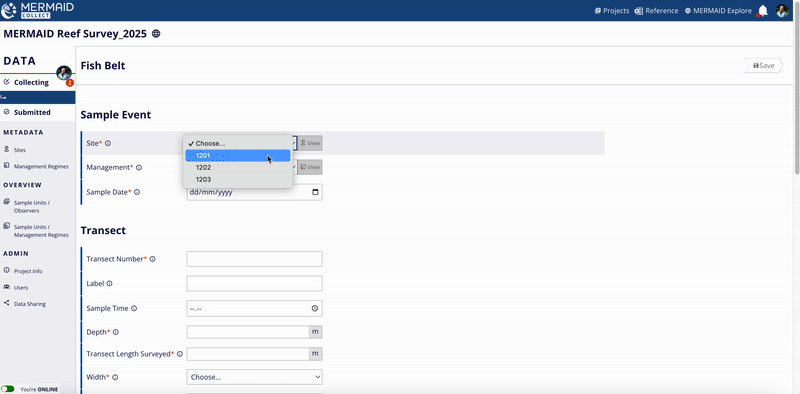
Defines where and when the fish belt survey was conducted. You'll select:
Site – From the list of sites added to the project. Learn more about adding sites here.
Management regime – From the list of management regimes added to the project. Learn more about adding management regimes here.
Date of survey – The date the sample unit was collected.
Each sample event (site, management regime, and date) is used to group your sample units for the reef health metrics calculations in MERMAID. Read more in Learning about Our Reef Health Metrics.

2. Transect
Protocol-specific fields for the fish belt survey:
Transect number
Depth (m)
Transect length surveyed (m)
Width (m) – This represents the total belt width surveyed combining both sides of the transect line. Options include:
Single-width belts for all fish sizes:
1 m
2 m
4 m
5 m
10 m
20 m
Mixed-width belts depending on fish size, where the width is automatically assigned based on each fish size observed:
<10 cm @ 2 m, ≥10 cm @ 5 m
<20 cm @ 2 m, ≥20 cm @ 4 m
<20 cm @ 4 m, ≥20 cm @ 8 m
≥10 cm & <35 cm @ 5 m, ≥35 cm @ 20 m
If a mixed-width belt option is selected, MERMAID will calculate the effective transect area for each fish record according to the rule.
For instance, under the rule <10 cm @ 2 m, ≥10 cm @ 5 m, a fish measuring 8 cm would be assigned a transect width of 2 m, while a fish measuring 12 cm would be assigned 5 m.
This feature is particularly useful when:
Different belt widths were used for different size classes;
Only one observer collected the data;
You wish to combine all observations into a single sample unit, while still accounting for the correct belt width per fish size.
Fish size bin (cm) – This represents the size class of the fish observed. Options are:
1 cm
5 cm
10 cm
AGRRA (Read more about AGRRA fish protocol here)
WCS India
For fish >50 cm, use the '50+cm' bin and enter exact size.
Optional fields – Reef slope, Visibility, Current, Relative depth, Tide, Notes.
Some fields use standardized dropdowns (e.g., belt width), while others accept numeric or free-text entries (e.g., transect length surveyed).
MERMAID requires you to specify the transect length surveyed and total belt width (m). These inputs are needed to calculate the surveyed area for biomass estimation (kg/ha). For example, a 50 m long transect with a 5 m total width covers 250 m², or 0.025 ha.
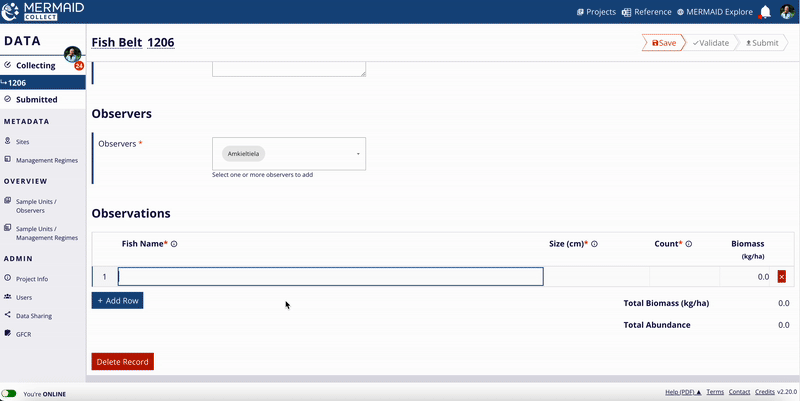
3. Observers
Assign the observer(s) who conducted the survey:
Select from the list of project users
Click to add/remove names
At least one observer is required per sample unit
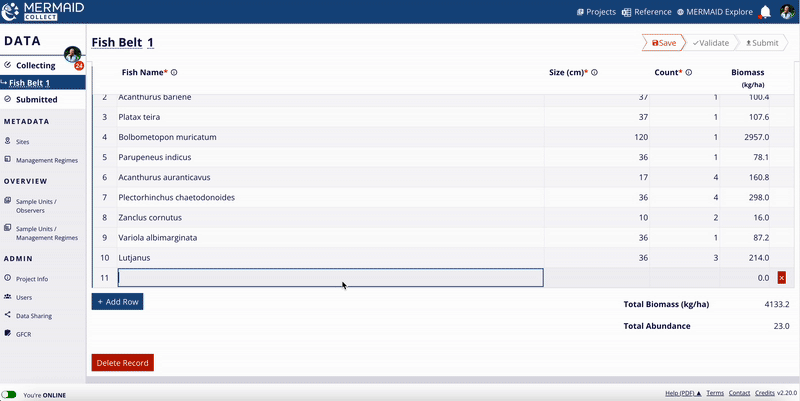
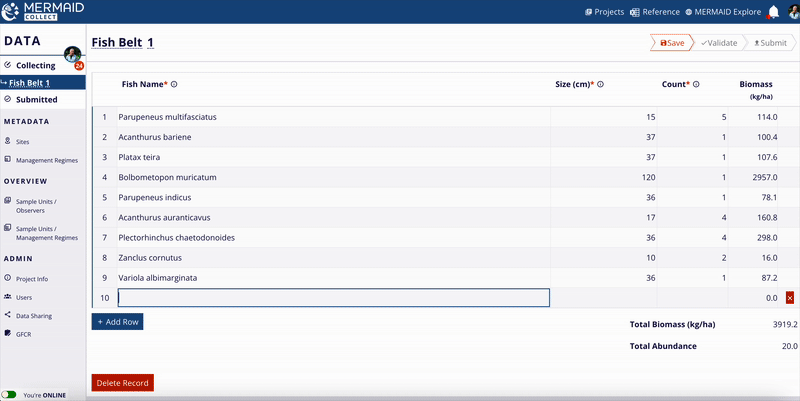
4. Observations
Enter your raw field observations:
Fish name – Enter the observed taxon; this can be at the species, genus, or family level, depending on the precision of your identification.
Size (cm) – Record the estimated total length of the fish (in cm) observed in this row.
Count – Enter the number of individuals observed for that fish name at the specified size.
Proposing a new fish species
If a fish species isn’t yet listed in the dropdown:
Type its name in the Observations table.
Select Propose new species….
Select Genus name from the dropdown and enter the Species name.
Click Next to review your suggestion.
Click Send to MERMAID to submit it for review.
If the genus is missing, select Contact us for help to notify the MERMAID team.
The fish taxonomy in MERMAID is standardized using the World Register of Marine Species (WoRMS) to ensure consistent species classification.
Note: Check the species in WoRMS to ensure the species name is accepted before submitting. Your entry will be provisionally included but becomes official only after reviewed and approved by the MERMAID Team. |
You can download the full list of available fish species using the Reference icon in MERMAID Collect.
Tips for data entry: Keyboard shortcuts and predictive text
Use these keyboard shortcuts and the predictive text to move quickly through the Observations table in a sample unit form:
Use the Tab key to move across fields in a row.
Use the Up and Down arrow keys to scroll through fish name suggestions.
Under the column Fish name, type a few letters of your observation (e.g., Istpla for Istiophorus platypterus), then use the arrow keys and Enter/Return/Tab to select it from the matching dropdown options. Or type until there’s only one option and press Enter/Return.
Press Tab at the end of a row to duplicate the observation in the next row—useful for entering different size bins for the same fish species in a transect.
Press Enter/Return to start a new row and begin typing the next observation.
This helps ensure consistent naming and speeds up your workflow—especially when entering lots of observations.
Metric summaries in a fish belt sample unit
MERMAID automatically calculates and displays key fish metrics as you enter observations, providing immediate feedback for data validation and quality control—even while offline.
Total biomass (kg/ha) is calculated in real time based on the surveyed area (transect length × belt width), fish size estimates, and counts. Calculations use Bayesian length–weight coefficients sourced from FishBase.
Total abundance (count of individuals) is computed automatically as the sum of all individual fish counts entered in the Observations table.
Reminder: Enter both transect length surveyed and belt width to activate biomass calculations. |
Read more about these calculations in Learning About Our Taxonomic Reference.
Collecting benthic data
When you're ready to enter your benthic observations from your dive sheets, navigate to your project's Collecting page and click + Add sample unit. Choose one of the benthic methods (i.e., Benthic PIT, Benthic LIT, or Benthic photo quadrat) to open a sample unit form organized into four main sections: Sample event, Transect, Observers, Observations.
MERMAID Collect supports three widely used benthic methods, i.e., point intercept transect (PIT), line intercept transect (LIT), and photo quadrat transect (PQT). Read more about our benthic methods in Supported survey methods.
Completing a benthic sample unit form
Note: Required fields are marked with a red asterisk (*). These include site, management regime, observers, and key transect attributes. Optional fields include time, visibility, current, tide, and notes. Helper text is available for every field—just click the info icon next to a label to view tips, definitions, and example entries. |
1. Sample event
Defines where and when the benthic survey data was conducted. You'll select:
Site – From the list of sites added to the project. Learn more about adding sites here.
Management regime – From the list of management regimes added to the project. Learn more about adding regimes here.
Date of survey – The date the sample unit was collected.
Each sample event (site, management regime, and date) is used to group your benthic sample units for the benthic % cover calculations in MERMAID. Read more in Learning about our reef health metrics.
Each sample event (site, management regime, and date) is used to group your sample units for the calculation of sample event summary for benthic % cover. Learn more in Learning about our reef health metrics.
2. Transect
Protocol-specific fields for the benthic survey:
Survey method | Protocol-specific fields |
All benthic methods | Transect number Depth (m) Transect length surveyed (m) Optional fields: Reef Slope Visibility Current Relative Depth Tide Notes |
Benthic PIT only | Interval Size (m) Interval Start (m) |
Benthic photo quadrat only | Quadrat number start Quadrat size (m2) Number of quadrats Number of points per quadrat |
Some fields use standardized dropdowns (e.g., reef slope, visibility) while others accept numeric or text-free entries (e.g., depth, transect number, transect length surveyed).
3. Observers
In this section, assign the person(s) who collected the observations underwater:
Select from the list of project users
Click to add or remove names
At least one observer is required per sample unit
Accurate attribution helps with training, reporting, and quality assurance.
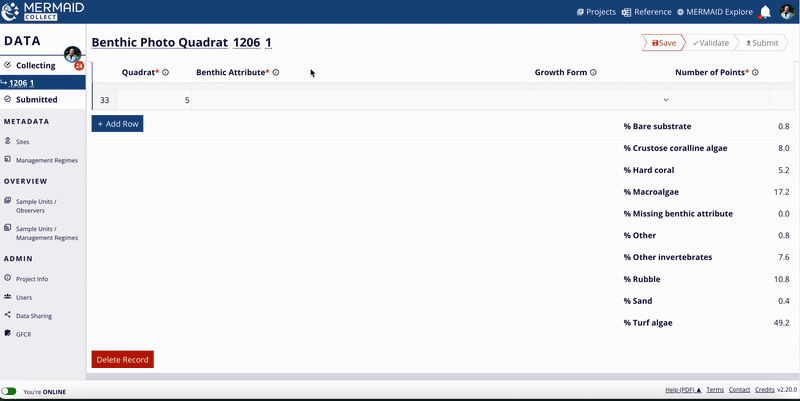
4. Observations
Here’s where you enter your actual data (observations):
Survey method | Protocol-specific fields |
All benthic methods | Benthic Attribute Growth Form |
Benthic LIT only | Length (cm) |
Benthic photo quadrat only | Quadrat number Number of points |
Suggesting a new benthic attribute
If a benthic attribute isn’t yet listed in the dropdown:
Type its name in the Observations table.
Select Propose new benthic attribute...
Enter the coral genus/family/top-level category in Parent and the species/genus in Name
Click Next to review.
Click Send to MERMAID to submit it for review.
If the parent (genus/family/top-level category) is missing, select Contact us for help to notify the MERMAID team.
The benthic taxonomy in MERMAID is standardized using the World Register of Marine Species (WoRMS) to ensure consistent species classification.
Note: Check the benthic attribute in WoRMS to ensure the species name is accepted before submitting. Your entry will be provisionally included but becomes official only after being reviewed and approved by the MERMAID Team. |
You can download the full list of available benthic attributes using the Reference icon in MERMAID Collect.
Tips for data entry: Keyboard shortcuts and predictive text
Use these keyboard shortcuts and the predictive text to move quickly through the Observations table in a sample unit form:
Use the Tab key to move across fields in a row.
Use the Up and Down arrow keys to scroll through benthic attribute suggestions.
Under the column Benthic attribute, type a few letters of your observation (e.g., Acropal for Acropora palmata), then use the arrow keys and Enter/Return/Tab to select it from the matching dropdown options. Or type until there’s only one option and press Enter/Return.
Press Tab at the end of a row to duplicate the observation in the next row—useful for entering multiple observations of the same benthic attribute in a transect.
Press Enter/Return to start a new row and begin typing the next observation.
This helps ensure consistent naming and speeds up your workflow—especially when entering lots of observations.
Metric summaries in a benthic sample unit
MERMAID automatically calculates and displays key benthic metrics as you enter observations, providing immediate feedback for data validation and quality control—even while offline.
For all benthic methods, percent cover is automatically calculated for each top-level benthic category (e.g., hard coral, soft coral, macroalgae) based on the observations you enter. These percentages are displayed beneath the Observations table. Each benthic attribute entered is hierarchically grouped into these broader categories commonly used in global reef monitoring.
Read more about these calculations in Learning About Our Taxonomic Reference.
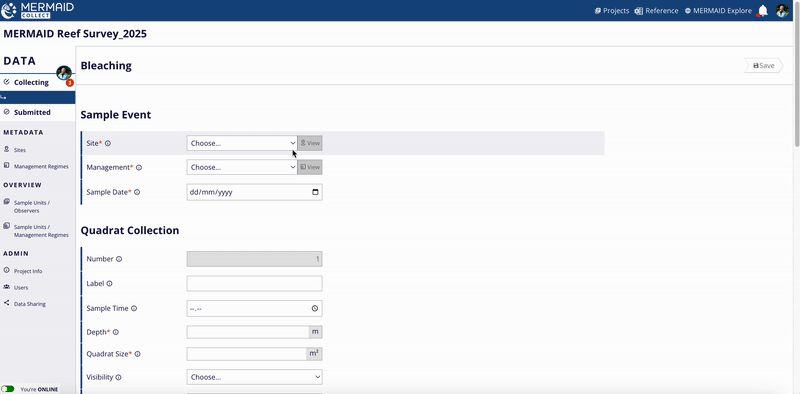
Collecting bleaching data
When you’re ready to enter bleaching data from your dive sheets, go to your project’s Collecting page and click + Add sample unit. Select the Bleaching method to open a sample unit form organized into four main sections: Sample event, Transect, Observers, Observations.
The bleaching method supported in MERMAID follows the rapid assessment field method as described in the McClanahan and Darling protocol. Each sampling unit consists of a collection of quadrats surveyed during a single dive or snorkel, with bleaching severity assessed for individual coral colonies and recorded at the genus level.
A more detailed description and video tutorial of the method can be found in Supported Survey Methods.
Completing a bleaching sample unit form
Note: Required fields are marked with a red asterisk (*). These include site, management regime, observers, and key transect attributes. Optional fields include time, visibility, current, tide, and notes. Helper text is available for every field—just click the info icon next to a label to view tips, definitions, and example entries. |
1. Sample event
This section defines where and when the bleaching survey data was conducted. You'll select:
Site – From the list of sites added to the project. Learn more about adding sites here.
Management regime – From the list of management regimes added to the project. Learn more about adding management regimes here.
Date of survey – The date the sample unit was collected.
Each sample event (site, management regime, and date) is used to group your sample units for the % colonies by bleaching severity category calculations in MERMAID. Read more in Learning about Our Reef Health Metrics.

2. Quadrat collection
Protocol-specific fields for the bleaching survey:
Depth (m)
Quadrat size (m2)
Optional fields – Reef slope, Visibility, Current, Relative depth, Tide, Notes.
Some fields use dropdowns with standardized values (e.g., visibility, current, relative depth); others are free text or numeric fields for flexibility (e.g., depth, quadrat size).
3. Observers
In this section, assign the person(s) who collected the observations underwater:
Select from the list of project users
Click to add or remove names
At least one observer is required per sample unit
Accurate attribution helps with training, reporting, and quality assurance.

4. Observations
Here’s where you enter your actual data (raw observations):
In MERMAID Collect, observations from this survey are recorded in two separate Observations tables:
Observations - Colonies bleached table records the total number of colonies in each bleaching category (i.e., normal, pale, 0-20% bleached, 21-50% bleached, 51-80% bleached, 81-100% bleached, recently dead) per coral genus (Benthic attribute).
Observations - Percent cover table records the % cover of hard coral, soft coral, and macroalgae for each quadrat.
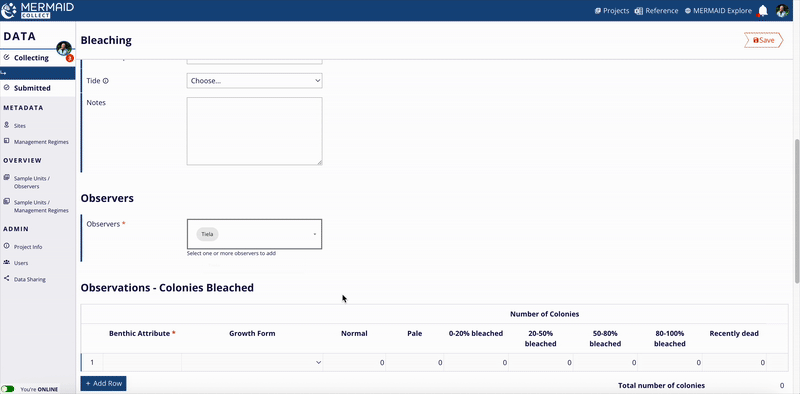
Suggesting a new benthic attribute
If a benthic attribute isn’t yet listed in the dropdown:
Type its name in the Observations table.
Select Propose new benthic attribute...
Enter the coral genus/family/top-level category in Parent and the species/genus name in Name.
Click Next to review.
Click Send to MERMAID to submit it for review.
If the parent (genus/family/top-level category) is missing, select Contact us for help to notify the MERMAID team.
The benthic taxonomy in MERMAID is standardized using the World Register of Marine Species (WoRMS) to ensure consistent species classification.
Note: Check the benthic attribute in WoRMS to ensure the species name is accepted before submitting. Your entry will be provisionally included but becomes official only after being reviewed and approved by the MERMAID Team. |
You can download the full list of available benthic attributes using the Reference icon in MERMAID Collect.
Tips for data entry: Keyboard shortcuts and predictive text
Use these keyboard shortcuts and the predictive text to move quickly through the Observations table in a sample unit form:
Use the Tab key to move across fields in a row.
Use the Up and Down arrow keys to scroll through benthic attributes suggestions.
Under the column Benthic attribute, type a few letters of your observation (e.g., Acropal for Acropora palmata), then use the arrow keys and Enter/Return/Tab to select it from the matching dropdown options. Or type until there’s only one option and press Enter/Return.
Press Tab at the end of a row to duplicate the observation in the next row—useful for entering consecutive observations of the same benthic attribute in a transect.
Press Enter/Return to start a new row and begin typing the next observation.
This helps ensure consistent naming and speeds up your workflow—especially when entering lots of observations.
Metric summaries in a bleaching sample unit
As you enter observations in a sample unit, MERMAID automatically calculates and displays key metric summaries to provide quick insights and support data quality checks — all available even when you’re offline.
For the bleaching method, MERMAID calculates:
Total number of coral colonies, and coral genera
% normal colonies, pale colonies, and bleached colonies
Average % hard coral cover, soft coral cover, and macroalgae cover
These metrics are displayed beneath the Observations tables and help you evaluate the bleaching severity in real time.
Read more about these calculations in Learning About Our Reef Health Metrics.
Collecting habitat complexity data
When you’re ready to enter habitat complexity data from your dive sheets, go to your project’s Collecting page and click + Add sample unit. Select the Habitat complexity method and fill out a structured form organized into four consistent sections.
This method records observations of benthic habitat complexity on a scale of 0 to 5 based on methodology proposed in Wilson et al. (2007), and described in Darling et al. (2017). A more detailed description of the method can be found in Supported Survey Methods.
Completing a habitat complexity sample unit form
Note: Required fields are marked with a red asterisk (*). These include site, management regime, observers, and key transect attributes. Optional fields include time, visibility, current, tide, and notes. Helper text is available for every field—just click the info icon next to a label to view tips, definitions, and example entries. |
1. Sample event
This section defines where and when the data was collected. You'll select:
Site – From the list of sites added to the project. Learn more about adding sites here.
Management regime – From the list of management regimes added to the project. Learn more about adding management regimes here.
Date of survey – The date the sample unit was collected.
Each sample event (site, management regime, and date) is used to group your sample units for the reef health metrics calculations in MERMAID. Read more in Learning about our reef health metrics.

2. Transect
This section captures the protocol-specific details of the habitat complexity survey. You’ll need to fill:
Transect number
Depth (m)
Transect length surveyed (m)
Interval size (m)
Some fields use dropdowns with standardized values (e.g., reef slope, visibility, current, relative depth); others are free text or numeric fields for flexibility (e.g., depth, transect length surveyed).
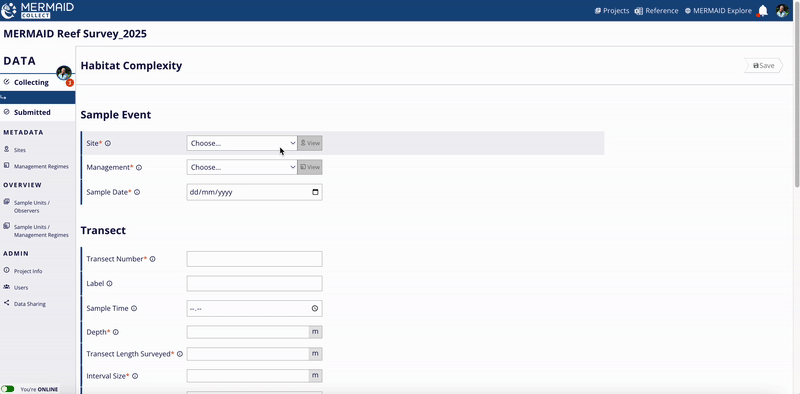
3. Observers
In this section, assign the person(s) who collected the observations underwater:
Select from the list of project users
Click to add or remove names
At least one observer is required per sample unit
Accurate attribution helps with training, reporting, and quality assurance.
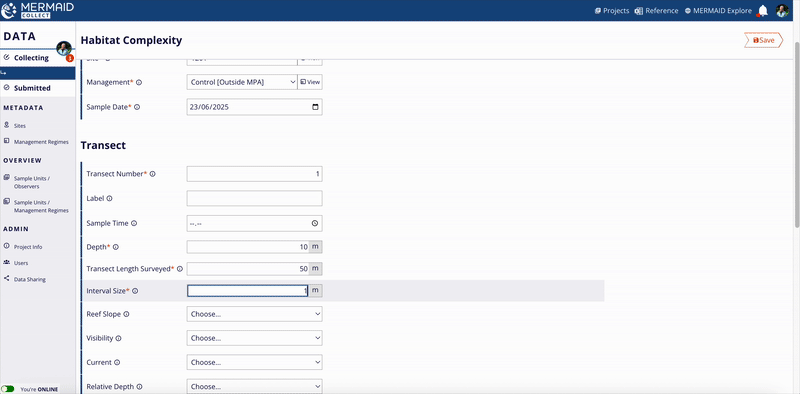
4. Observations
Here’s where you enter your actual data (raw observations).
Enter the habitat complexity score for each interval. The number of rows in this table must match the number of intervals surveyed along the transect length to ensure complete data entry.
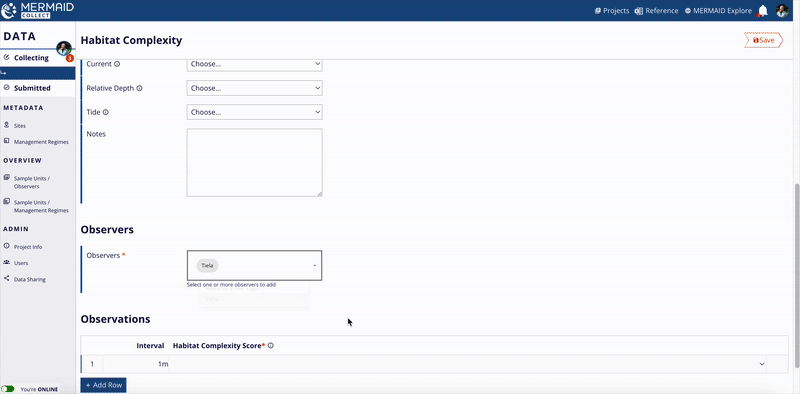
Tips for data entry: Keyboard shortcuts and predictive text
Use these keyboard shortcuts and the predictive text to move quickly through the Observations table in a sample unit form:
Use the Tab key to move across fields in a row.
Use the Up and Down arrow keys to scroll through habitat complexity score suggestions.
Click the Habitat complexity score column, then use the arrow keys and Enter/Return/Tab to select it from the dropdown options.
Press Tab at the end of a row to duplicate the observation in the next row—useful for entering multiple observations of the same complexity score in a transect.
Press Enter/Return to start a new row and begin typing the next observation.
This helps ensure consistent naming and speeds up your workflow—especially when entering lots of observations.
Metric summaries in a habitat complexity sample unit
As you enter observations in a sample unit, MERMAID automatically calculates and displays key metric summaries to provide quick insights and support data quality checks — all available even when you’re offline.
For habitat complexity surveys, MERMAID calculates the average complexity score (scale 0–5) across all intervals entered. This provides an overview of structural habitat condition for each transect and this metric summary can be viewed in the exported data file once data is submitted in the Submitted page.
Saving, validating and submitting data
1. Saving a sample unit
Saving your work regularly is essential while collecting data in MERMAID Collect. Whether you're online or offline, all sample units are saved locally to your computer to ensure nothing is lost.
Here’s how saving works:
When you enter new information into a sample unit, the Save button in the upper-right corner will turn bright red.
Click the bright red Save button to save your progress.
Once saved, the button will turn gray and display the label Saved, indicating there is no new data to save.
You can always return to any saved sample unit later to add or change data, then save again.
Automatic prompts for unsaved data
If you try to navigate away from a page with unsaved changes:
MERMAID will show a warning message that you have unsaved data.
Select Cancel to remain on the page and save.
Select OK to leave the page without saving your recent changes.
2. Validating a sample unit
After saving your data in a sample unit, the next step is to validate it. Validation is like proofreading your data—it helps catch common errors, inconsistencies, missing observations or outliers before submission.
Reminder: Validation and submission can only be done online. You will not see the Validate and Submit button when offline. |
After saving your sample unit, the red Validate button becomes visible next to the Saved button at the top of the page. Click in Validate to start your validation. MERMAID will run automated checks across the form and observations. Once completed, the validation will either be successful or flag warnings and/or errors in your sample unit.
If validation is successful
Your sample unit has no issues. The Submit button will now be active in red, and the Validate button will be grayed out. Your sample unit is ready to be submitted.

If validation flags warnings and/or errors
A red message Errors or warnings are preventing you from submitting will appear under the Submit button if any issues are detected.
Warnings and errors are displayed in three places to help you quickly find and fix them:
At the top of the page
Next to affected fields or rows (highlighted in yellow for warnings and red for errors)
In the Validations column in the Observations table, if there are any issues with the observations.
Tip: Click Scroll to observations next to any message to jump directly to the affected row or field. |
How to resolve warnings and/or errors
Warnings indicate unusual but possible data (e.g., an unusually large fish or unexpected coral genus).
You can either:
Resolve the warning by editing the data field or using the Resolve button next to the field.
Ignore the warning by checking the Ignore warning box next to it or on top of the page next to the warning message, if your data is correct.
Errors indicate missing or invalid data (e.g., a required field left blank, an invalid value). These must be fixed before a sample unit can be submitted. Errors are marked clearly in red next to affected fields.
To resolve:
Scroll to the error(s).
Make the necessary correction(s).
After making changes, save and revalidate to confirm that the warning(s) and/or error(s) has been addressed. Repeat the process until all errors are cleared.
Each sample unit’s validation status is visible on the left side of each sample unit row in the Collecting page. Use this status to keep track of progress and know which units need attention. Read more in How Data Collection Works.
Tip: Click Scroll to observations at the top of the page to quickly locate issues in the sample unit form. |
Each sample unit’s validation status is visible on the left side of each sample unit row in the Collecting page. Use this status to keep track of progress and know which units need attention. Read more in How Data Collection Works.
Common warnings and error messages
Below are some of the most common warnings and errors you might encounter, and how to address them—organized by survey method.
Survey method | Type of validation | Message | How to fix it |
Across methods | Warning | Fewer than 5 total observations | Review the Observations table and add any missing observations if this was an error; or ignore the warning if this reflects real field conditions. |
Warning | Coral or fish not previously observed in site region | Confirm species ID and spelling in the Observations table. If correct, ignore the warning. | |
Warning | Other sample events at this site have a different management regime. Go to Management Regime Overview. | Review the management regime for the site in the Sample Unit / Management Regimes table. If correct, ignore the warning. | |
Error | One or more invalid fields: site, management, sample date, transect number, depth, transect length, observers | Check that all required fields in Sample event and Transect/Quadrat collection are filled correctly and completely. | |
Error | Incorrect number of observations; expected/Number of entered rows doesn’t match expected number of points | Confirm transect length and interval size in the Transect section. Adjust observation rows to match (e.g., 10 m long transect with a 0.25 m interval size = 40 expected observation rows). | |
Fish belt | Warning | Total biomass less than 50 kg/ha | Double-check species names, fish sizes, and counts in the Observations table. Ensure belt width and transect length are entered; or ignore the warning if this reflects real field conditions. |
Warning | Total biomass greater than 5,000 kg/ha | Check for data entry errors in the Observations table—especially very large fish sizes or high counts; or, ignore the warning if this reflects real field conditions. | |
Warning | Total fish count less than 10 | Add any missing fish observations in the Observations table, or, ignore the warning if this reflects real field conditions. | |
Warning | Fish size is larger than maximum observed size | Verify fish size is realistic in the Observations table. Adjust if entry was a mistake. | |
Error | One or more invalid fields: width, fish size bin | Choose valid dropdown options. Do not leave required fields blank in the Transect section. | |
Error | Invalid fish size | Enter a valid numeric fish size in cm, consistent with the size bin in the Observations table. Avoid decimals or unusual formats. Do not leave size fields blank. | |
Benthic PIT | Error | One or more invalid fields: interval size, interval start | Check that numeric values are entered correctly and logically, in m. Do not leave required fields blank in the Transect section. |
Benthic LIT | Error | Total observation lengths ≠ transect length | Sum your observation lengths in the Observations table and adjust as needed to match the entered transect length; or adjust transect length to match the sum of your observations lengths in the Transect section. |
Benthic photo quadrat | Warning | Total number of points entered for quadrats does not match defined number of points per quadrat | Count all points recorded in the Observations table in each quadrat. Adjust observations so the total matches the points per quadrat defined in the Transect section. |
Warning | Defined number of quadrats does not match count of quadrats in observations | Check the total number of quadrats in the Observations table. Add or remove observations so that the number of unique quadrats matches the number you entered in the Transect section. | |
Warning | Missing quadrat numbers | Ensure that all observations have a Quadrat number in the Observations table. | |
Error | One or more invalid fields: quadrat number start, number of quadrats, quadrat size, number of points per quadrat | Ensure these fields are filled using valid dimensions (e.g., 0.5 m², 1 m²). Do not leave required fields blank in the Transect section. | |
Bleaching | Error | One or more invalid fields: quadrat size | Ensure this field is filled using valid dimensions (e.g., 0.5 m², 1 m²). Do not leave required fields blank in the Transect section. |
Error | Each percent cover must be a positive number, and not blank. Invalid values | Enter a positive, whole number (e.g., 0–100%). Leave no fields blank in the Observations - Percent cover table. | |
Error | Duplicate colonies bleached observations | Ensure each benthic attribute (e.g., Acropora entered twice) is listed only once in the Observations - Colonies bleached table. Remove duplicates or consolidate into a single entry. | |
Habitat complexity | Error | One or more invalid fields: interval size | Enter valid numeric interval values in m (e.g., 0.5, 1.0) in the Transect section. |
3. Submitting a sample unit
Once all errors have been corrected and warnings have been addressed (or ignored), the Submit button will become active.
Click the red Submit button to finalize the sample unit.
After submission is complete, you’ll read a message Record submitted.
Submitting moves it from your personal Collecting page to the shared Submitted page.
If you’re a Collector in the project: Submitting should only be done when your data is clean and complete. You can’t edit a sample unit after submitting it unless an Admin transfers it back to you.
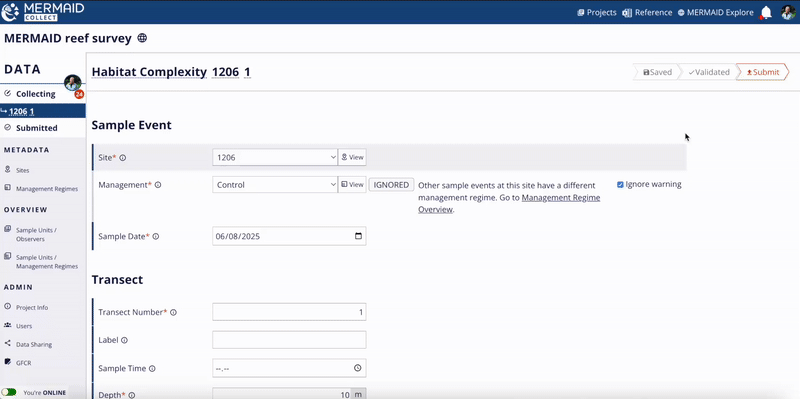
4. After submission
After submitting sample unit(s), all project users can:
View and export submitted data from the Submitted page.
View it in MERMAID Explore. Click the Globe icon next to your project name to jump straight to the map view in Explore and view your submitted data. Read more in Viewing Your Project(s) Only in Using MERMAID Explore.
Access it via the MERMAID R package in R using a filter function. Read more in Accessing Project Data from MERMAID.
Only users with an Admin role can edit, unsubmit, or return a submitted sample unit to a Collector for further editing.

Using AI image classification (beta) for benthic photo quadrats
Getting started
Discover AI image classification (beta) in MERMAID Collect, our first feature powered by MERMAID AI.
Through a partnership with CoralNet from the University of California San Diego and Scripps Institution of Oceanography, MERMAID now includes AI-based support for benthic image analysis. Our Image Classification (Beta) feature leverages this collaboration, allowing you to streamline and standardize the processing of benthic photo quadrats. Upload entire transects, apply automatic point-based classification using a pre-trained model, and interactively review results—all within an efficient workflow from your project in MERMAID Collect.
Each photo is classified using a fixed grid of 25 points and a standardized set of benthic attribute labels, supporting data comparability across datasets and projects within MERMAID.

Important: Beta feature and user review
|
High-level workflow
The process is designed to be straightforward:
Enable Image Classification (Beta) for your benthic photo quadrat sample unit.
Upload your quadrat photos.
MERMAID AI automatically classifies 25 points in each photo.
Review and confirm all 25 points for each photo, making adjustments as needed.
Submit your validated data.

Ready to try it out? Here’s how to quickly enable and use the feature:
Navigate to your project in MERMAID Collect and go to the Collecting page.
Click +Add sample unit and select Benthic photo quadrat.
Click on Classify photos with AI (Beta).
Complete the required fields in the Sample Event and Transect sections. The “Number of quadrat points” will be automatically set to 25.
Click Upload photos and add your images. The MERMAID AI model will begin processing immediately.

For more a detailed step-by-step guide, navigate to the next sections in Using AI image classification (beta) for benthic photo quadrats.
Preparing your photos for AI image classification (beta)
To ensure reliable and accurate classification results from the MERMAID AI model, it’s important to prepare and capture high-quality photos. The AI model depends on consistent visual input, so attention to photo quality, framing, and orientation directly improves classification performance and reduces the need for manual corrections.
Follow these best practices when capturing or preparing your photos from benthic photo quadrat surveys for classification in MERMAID Collect:
1. Ensure clear, in-focus photos
Photos should be well-lit, sharp, and free of motion blur.
Avoid photos with poor contrast or heavy shadows, which may obscure benthic features.
Use a camera with a resolution of at least 12 megapixels for best results.
Photo dimensions must be at least 1500 x 1500 pixels.
2. Minimize area outside the quadrat frame
Crop your photos to include only the area within the photo quadrat, removing excess background and frame edges where possible.
This ensures the AI model classifies only the benthic substrate and avoids mislabeling artifacts outside the sampling area.
If your quadrat has a PVC or metal frame, it is acceptable for it to appear in the photo as long as it does not dominate the view.
3. Use a consistent top-down perspective
Capture photos perpendicular to the reef surface to minimize distortion, and at a consistent distance from the benthic surface.
Ensure the quadrat is evenly aligned in the photo frame, without tilting or rotation.
4. Maintain consistent scale and coverage
Use the same quadrat size and camera height throughout each transect in a survey to keep spatial resolution consistent.
Ensure the entire quadrat area is visible and not cropped during capture.
5. Avoid obstructions
Remove divers’ fins, measuring tapes, or equipment from the field of view before capturing the photo.
Ensure no bubbles, debris, or marine life obstruct the benthic surface.
6. Standardize photo formats
Upload photos in JPEG, PJPEG, MPO, or PNG format.
Keep filenames clear and consistent (e.g., SiteName_Transect01_Quadrat05.jpg) for easier tracking and management.

Enabling AI image classification (beta) for benthic photo quadrats
In MERMAID Collect, you can either:
Manually enter photo quadrat data (see the benthic photo quadrat documentation) previously processed using an external software (e.g., CoralNet, CPCe, ReefCloud).
Use AI image classification (beta) to semi-automatically classify photos and review points.
To enable AI classification:
Navigate to your project from the main Projects page in MERMAID Collect.
Go to the Collecting page on the left sidebar.
Click on +Add sample unit on the top-right.
Select Benthic photo quadrat from the dropdown menu.
Click on Classify photos with AI (Beta).
In the sample unit form, complete required fields (with the red asterisk *) in Sample event and Transect sections. The field for “Number of quadrat points” in the Transect section will automatically be set to 25. You cannot edit this field.
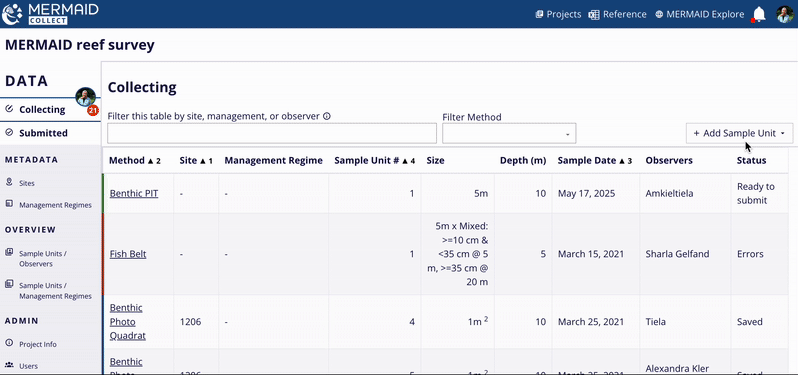
Uploading and classifying photos
After enabling AI image classification (beta) and completing all required fields in the form, click Upload photos at the bottom of the page. Drag and drop multiple photos or select from your computer. MERMAID will automatically assign a quadrat number for each photo based on the upload sequence.
Note:
|
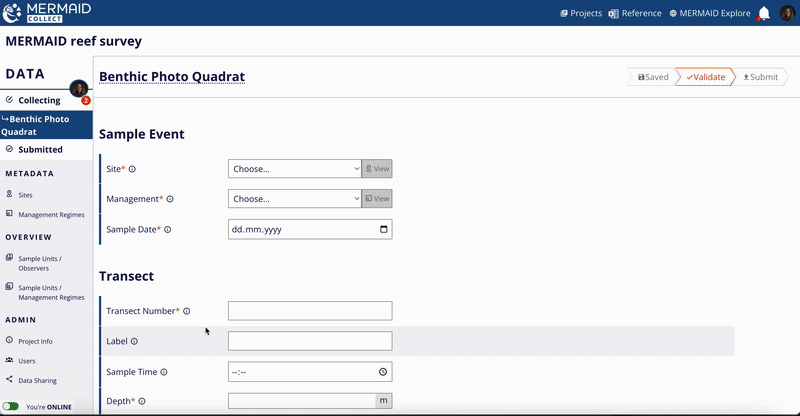
Once uploaded, the MERMAID AI model will immediately begin processing and classifying each photo.
After processing, classified and unclassified points (25 total) appear in the Observations table for each photo, representing separate individual quadrats.
Important notes on processing & classification:
All points (classified and unclassified) require user review and confirmation. |

Reviewing and confirming image classifications
Each classified photo must be manually reviewed. All 25 points for each photo require your confirmation, including both model-classified and unclassified points.
Understanding point markers:
Grey dashed squares: Unclassified points that require manual classification and confirmation.
Orange dashed squares: Points automatically classified by the model that still need to be reviewed and confirmed.
Solid orange squares: Points that have already been confirmed by the user.
When reviewing and confirming points—whether classified by the model or unclassified—you should identify the dominant benthic attribute visible within the entire square. The ‘+’ is a guide to the centre of the square, but the model will use pixels in the full square to classify a benthic attribute. If there are multiple attributes in a square, we recommend choosing the most visually prominent component inside the square.
Confirmed attributes may include both a benthic attribute (e.g., Hard Coral) and a specific growth form (e.g., Branching) or just a benthic attribute (e.g., Stylophora). A full list of detectable attributes is provided in the “Benthic Attribute Labels Used in Image Classification (Beta)” section below.
To systematically review and confirm points:
Click Review next to a photo or directly on it in the Observations table to open the review window.
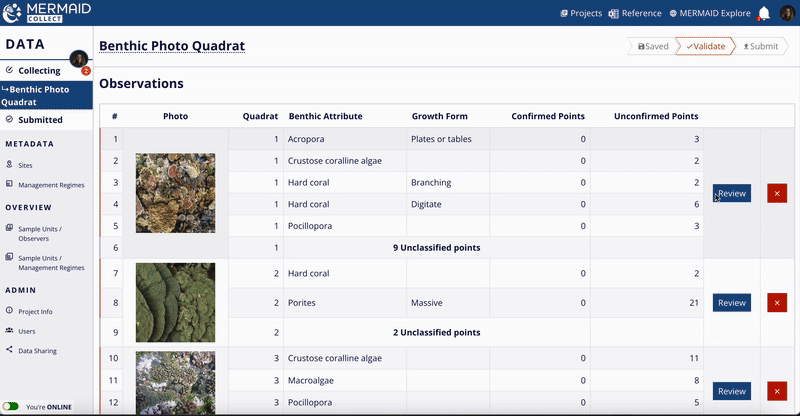
Click on each square point to review and confirm a benthic attribute. A pop-up will show the model classification (classifier guess) with the confidence level for the guess.
Click Confirm to accept the model classification.
Or select another benthic attribute from the dropdown below (which lists other attributes classified in the photo), or click on Select new attribute to add a new benthic attribute and a growth form (optional), then click Confirm.
Note: You can select a new benthic attribute based on the MERMAID taxonomic reference and confirm the point with that attribute (our benthic taxonomic reference can be found here).
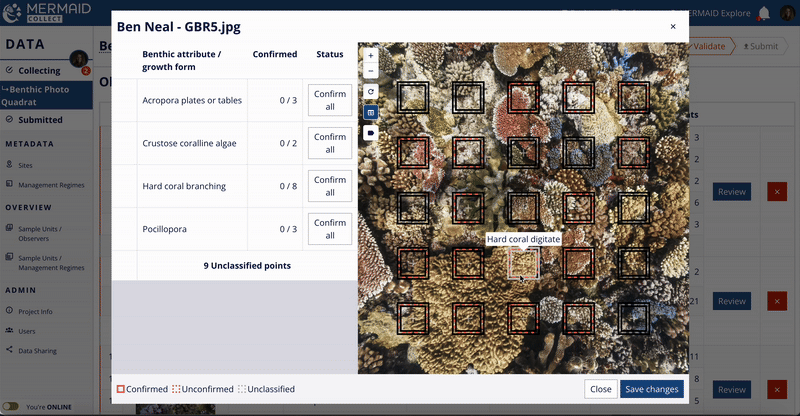
Confirmed points turn solid orange, and the total number of confirmed points will be updated for each benthic attribute in the table.
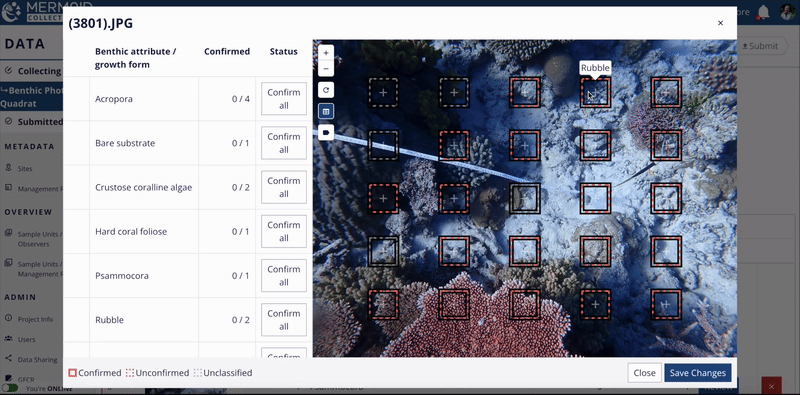
You can confirm all points assigned to the same benthic attribute at once by clicking the Confirm all button on the right side of the attribute row in the table.
Caution: Before using this option, carefully review each point associated with the attribute to ensure correct classification. This bulk confirmation should only be used when you have verified that all points are accurately classified. |
Use left/right arrows to navigate through all 25 points. The right arrow takes you to the next unconfirmed point.
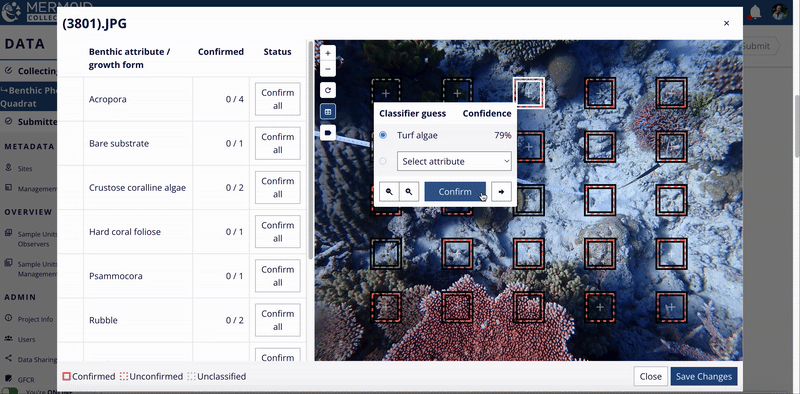
When all points are confirmed, click Save changes and close the window.
Repeat for all uploaded photos.
To delete an image, click the red X icon in the Observations table.
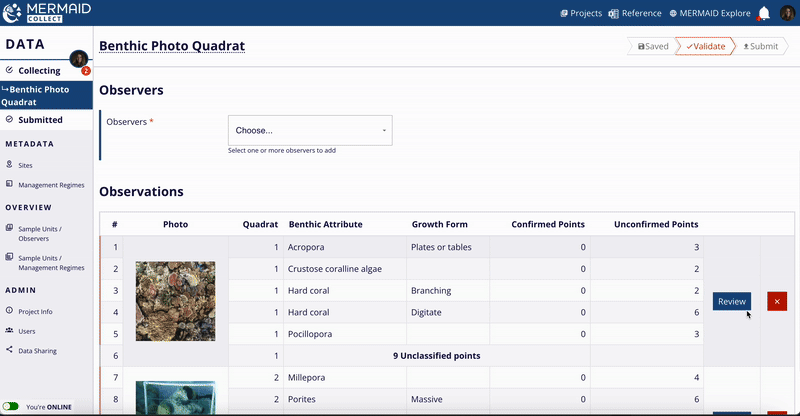
Once all uploaded photos have been reviewed and all points confirmed, save, validate and submit your benthic photo quadrat sample unit, following the same procedures as for any other sample unit.
Tip: Use color status in the Observations table to inspect which points have been confirmed and which photos are completed:
|
Navigating the review window
The review window offers several tools to help you efficiently review and confirm point classifications:
Point markers visual key:
Grey dashed squares: unclassified
Orange dashed squares: model-classified
Orange solid squares: confirmed by user
Table interaction:
Hovering over a table row highlights associated points to the benthic attribute in light grey in the photo.
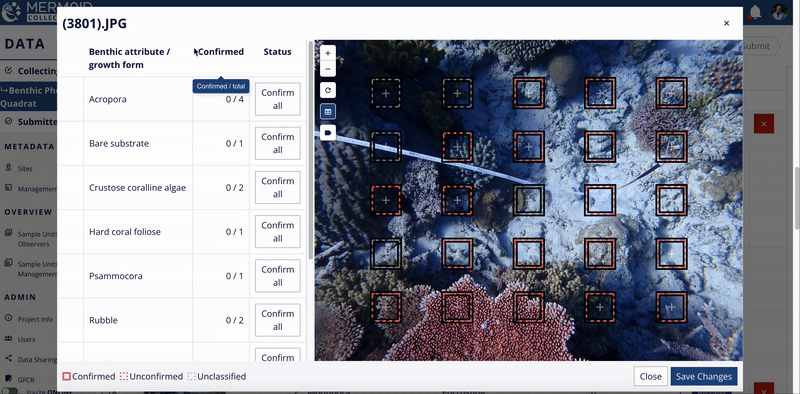
Clicking a table row selects/deselects associated points to the benthic attribute. When selected, associated points are highlighted in white on the photo.
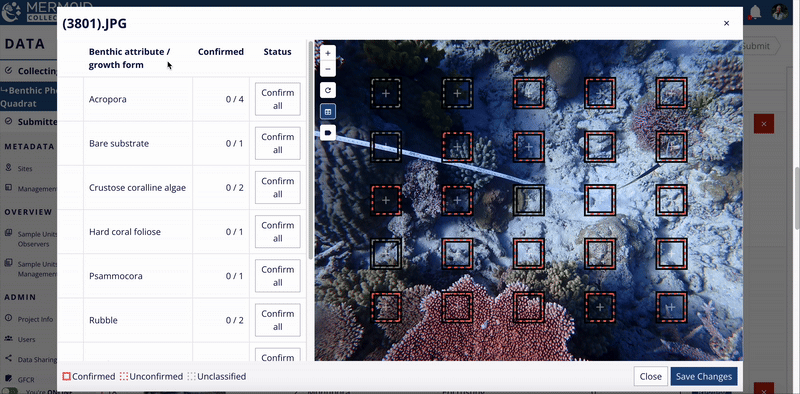
Zoom into all points of a table row associated with a benthic attribute using the magnifying glass icon.
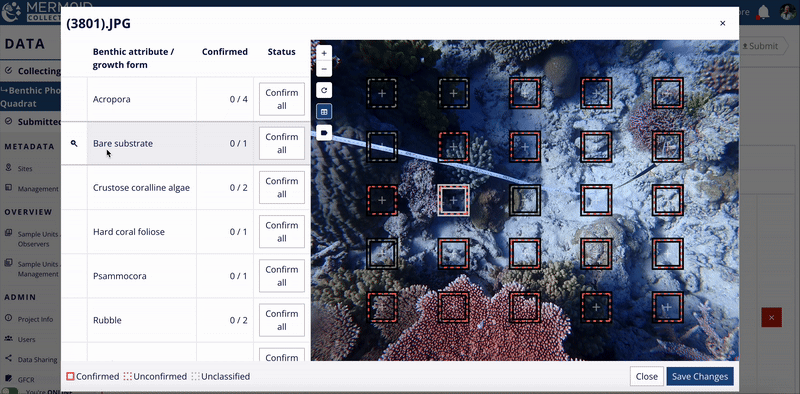
Zoom controls:
Zoom the photo using +/- buttons on the photo, mouse scroll, trackpad, or double-click.
Reset the view using the Reset icon.
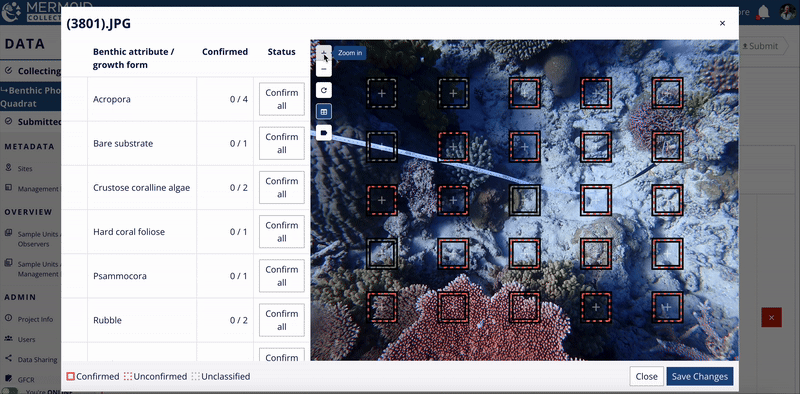
Visibility toggles:
Toggle label visibility to show/hide benthic attribute labels on each point.

Understanding the AI model for image classification (beta)
How the model works
The MERMAID AI: Image Classification (Beta) model was developed in collaboration with CoralNet, using its pyspacer framework for training deep learning models for image classification. Details of the pyspacer framework can be found in the following publication:
Chen, Q., Beijbom, O., Chan, S., Bouwmeester, J., & Kriegman, D. (2021). A New Deep Learning Engine for CoralNet. In Proceedings of the International Conference on Computer Vision (ICCV) Workshops. |
The MERMAID AI model was trained using a diverse set of publicly available CoralNet images. By integrating the majority of public CoralNet training data into a single generalized model, the MERMAID AI model makes reasonable inferences for a diverse set of images.
You can review the performance results for the MERMAID AI model in this GitHub documentation.
MERMAID is committed to the continuous improvement and refinement of this model.
Citation Suggestion |
Benthic attribute labels used in the model
The image classification model is currently trained on both top-level benthic categories and coral genera with growth forms, listed below. MERMAID aims to continuously improve and expand the benthic attributes used in the training and model classifications. We will continue to update this list, as image classifications for more benthic attributes are added by MERMAID users.
Top-level benthic categories:

Coral genera and growth forms:

How MERMAID uses your photos
When you upload photos for Image Classification (Beta) in MERMAID Collect, you’re helping build a global resource for coral reef science and improve MERMAID AI for all users. These photos power new AI and machine learning tools that help identify benthic attributes automatically from coral reef images. To support this innovation, MERMAID treats your photos differently from your other data.
Here's what you need to know:
1. Your photos are anonymized and stored in a public bucket.
All uploaded photos are stored in a public bucket on Amazon Web Services (AWS). MERMAID automatically strips these photos of all EXIF metadata, including personal and location data such as the date, time, and GPS coordinates, ensuring they are anonymized.
2. Your data sharing policy applies only to your project data, not your photos.
Even if your project is set to “Private” or “Public summary”, photos may still be used publicly for training and improving MERMAID’s AI image classification models. While photos are publicly accessible via the AWS bucket, your classification results and other project data remain protected by the data sharing policy you've selected for your project(s). These outputs are not publicly accessible and cannot be linked back to your project through the photos. Users cannot access your classification results or any other project data unless explicitly shared through your project’s data sharing policy (i.e., Public summary or Public).
3. Your photos may be used for AI and other public tools.
Once stripped of metadata and being anonymized, your photos may be shared publicly and used by MERMAID and others for:
Training machine learning and artificial intelligence (AI) models for MERMAID AI.
Creating labeled or annotated datasets.
Improving coral reef monitoring tools. This helps MERMAID provide faster, smarter tools for all users of the platform.
4. No one can see where your photos were taken—unless they’re in your team.
Other users (including the public) won’t see which project, site, or transect your photos came from. Only authenticated users within your project team can access this additional information, through the MERMAID API or internal project access e.g., using MERMAID Collect.
5. You retain control of your project and data.
While your photos may be used in broader ways to enhance AI models, your observations, site-level summaries, and other project data remain protected according to the data sharing policy you’ve selected. This ensures that only anonymized photos are used to improve machine learning models for coral reef monitoring.
See more on the MERMAID Terms of Service.
Managing data and projects
Overview of data and projects
Managing your projects
The Projects page is your main space where you’ll find every project you’re part of—whether you're a user with an Admin, Collector, or Read-only role.
At a glance, you’ll see key stats for each project:
Number of unsubmitted and submitted sample units
Sites
Users
Data sharing policies selected per survey method
If you have an Admin role, you'll see an Admin tag by the project name.
You can also check whether a project is enabled for offline use by inspecting the Offline ready box in each project card.

Quick navigation to projects
You can hop into your Projects page anytime by clicking MERMAID Collect at the top left or the Projects tab in the top menu. Want to jump right into collecting data or managing users in a project? Each section on a project card on the page links directly to tabs:
Collecting
Submitted
Sites
Data sharing
This gives you one-click access to the sections you need to keep your project moving.
Copying projects
Running a repeat survey or working with different stakeholders like donors who require separate datasets? Use the Copy button on a project card to create a new project with the exact same setup as the existing one—no need to rebuild it from the ground up.
This is ideal for:
Seasonal or annual survey cycles
Projects tied to different funding sources or partners
Cases where data must be kept separate due to sharing restrictions
Copying a project preserves its structure—project info, users, organizations, sites, management regimes, and data sharing settings—so you can get started faster and stay consistent across projects.
Clicking Copy duplicates the project’s:
Project info
Organization(s)
Users and their roles
Data sharing policies
Sites
Management regimes
This saves time and ensures consistency across projects—especially useful when managing surveys across multiple years or regions.
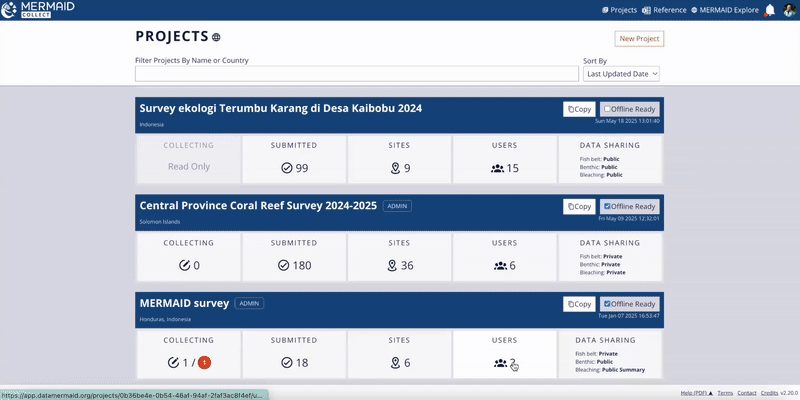
Filtering and sorting projects
On the Projects page, you can easily find the project you’re looking for:
Filter projects by name or country using the search field labeled Filter projects by name or country.
Sort projects using the dropdown menu next to the filter field. You can sort by:
Last updated date
Project name
Country
Navigating to MERMAID Explore
From the Projects page, you can jump straight into MERMAID Explore while staying logged in.
Simply click MERMAID Explore in the top-right corner of the page, or click the globe icon next to the PROJECTS title.
Downloading References
Need MERMAID’s list of fish and benthic attributes? You can download the latest Reference file directly in the top-right corner of the Projects page.
Project notifications
Stay up to date the notification bell in the top-right corner of the Projects page.
A red dot indicates there are new notifications, such as:
Project changes
MERMAID product updates or feature releases
Click Dismiss all notifications to clear them once reviewed.

Managing data in a project
Once you’re inside a project, MERMAID makes it easy to track progress of data collection and pinpoint where your team’s attention is needed.
The OVERVIEW section provides a high-level snapshot of your project's status—so you can quickly monitor survey progress, check for missing submissions, and ensure data consistency across your sites. It includes two tabs:
Sample units / Observers
This tab shows what data has been submitted—and what’s still pending. You can filter the table by site or method and sort the table based on site and/or method.
For each site and method, you can:
View individual submitted sample units under Submitted on the table’s left side. This column will only appear if there is at least one submitted sample unit in a project.
View individual unsubmitted sample units for each user under Collecting on the table’s right side.
Hover on any sample unit number to view additional details like last editor, observer(s), site name, management regime, and survey date.
Click View submitted sample unit to jump directly into the submitted data.
Best for: Following up with team members on any missing or unsubmitted sample unit. |

Sample units / Management regimes
This tab organizes submitted sample units by management regime—helping you verify governance-related data accuracy. You can filter the table by site or method and sort the table based on site and/or method.
Note that only management regimes with submitted data will appear.
For each site and method, you can:
View individual submitted sample units by management regime
Click on any sample unit number to jump directly into the submitted data.
Best for: Reviewing and verifying that each sample unit has the correct management regime assigned for the right site and date. |

Filtering sample units
To focus your review, both tabs include filter options at the top so you can narrow the sample units shown by site and method.
You can filter by:
Site – Enter the site name in the Filter this table by site field (top left)
Survey method – Select the method from the Filter method dropdown (top right)
As you apply filters, the sample unit totals update automatically—giving you real-time feedback on your data view.
Editing data
MERMAID allows you to reassign and edit sample units to help teams manage data entry smoothly—especially when someone leaves a project or can’t complete their work.
Transferring unsubmitted sample units (Admins only)
If a team member hasn’t finished entering data and is no longer available, an Admin can transfer their unsubmitted sample units to another user so someone else can pick up where they left off—without losing any data.
How to transfer unsubmitted data:
Go to the Users page in your project.
Click Transfer next to the original user's name.
Choose the new user who should receive the unsubmitted sample units from the dropdown options.
Confirm by clicking Transfer sample units. All transferred unsubmitted sample units will be available in the assigned user’s Collecting page.
Important:
|
Editing submitted sample units (Admins only)
Go to the Submitted page within your project.
Click the sample unit you want to edit from the list.
Click Edit sample unit – Move to Collecting to open it for editing. The sample unit is now available in your Collecting page.
Alternatively, you can select a sample unit from one of the OVERVIEW pages (Sample units / Observers and Sample units / Management regimes), then click on the Edit sample unit – Move to Collecting button to start editing from your Collecting page.

Editing unsubmitted sample units (Collectors and Admins)
Users with the Collector or Admin role can edit sample units before submission, and from their Collecting page. They can make edits at any time by opening their sample unit in their Collecting page. Once submitted, edits are restricted to project Admins.
Important:
|
Exporting data
MERMAID makes it easy to export submitted data for further analysis or reporting. All users—whether Admin, Collector, or Read-Only—can export data from a project.
Exporting data from a project
You can export submitted sample units in tabular XLSX format directly from the Submitted page in your project.
Note: You must be online to export data, and only submitted sample units can be exported. |
How to export data:
Go to the Submitted page in your project.
Click the Export to XLSX button and select the method you want to export data for.
Only methods with submitted sample units will be selectable. Greyed-out options mean no data has been submitted for that method.
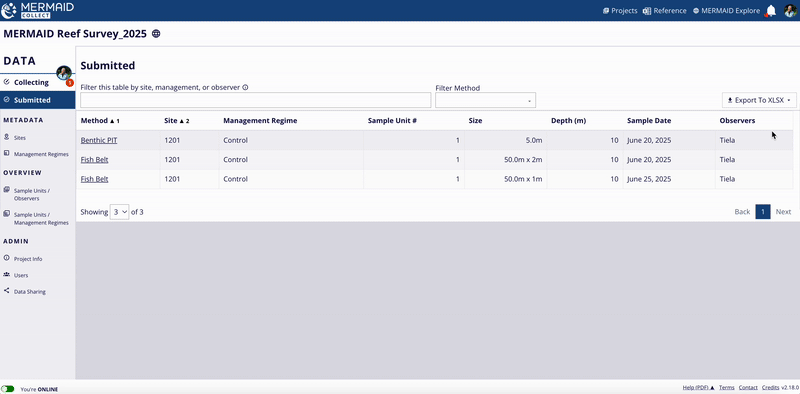
You’ll get a confirmation message Export Successful. A download link will be sent to your MERMAID account email.

Click the link in your email message to download the XLSX file.
All submitted sample units using a selected method will be combined into one spreadsheet.
If your project is a test project:
You can export data from test projects for trial analysis—but these data:
Will not be included in the metric summaries in MERMAID Explore
Will not appear as charts in MERMAID Explore
To change a test project to an actual project:
Go to the Data sharing page in the project’s sidebar.
Uncheck the checkbox This is a test project at the bottom.
Wait approximately 15 minutes for the data to sync with the server.

Exported data files
MERMAID provides standardized export files in XLXS format, which include all submitted sample units at the observation level (this is your raw data) and calculated metric summaries at the sample unit and sample event levels. These files are designed to support both quick review and in-depth analysis using tools like Excel, R, or other data platforms.
How exported data files are formatted
Each exported XLSX file contains the same set of standardized tabs:
Sheet name | Description |
Metadata | Project-level metadata as defined in the Project Info page, including project name, location, organizations, data sharing settings, and citation. |
Sample event (SE) | Summary statistics (means and standard deviations) across all sample units collected at a site on the same date and depth. |
Sample units (SU) | Summary statistics (sums/means) across all observations within each individual sample unit. |
Observations (Obs) | All individual observations collected at each site/date/depth, per sample unit. |
Charts | (Coming soon) Pre-generated charts for metrics using pivot tables. |
These tabs provide progressively more granular data:
Sample event: Aggregated at site-date-depth level
Sample units: Aggregated within each sample unit
Observations: Raw-level observation data
What metric summaries are included
Exported files include all metric summaries that are automatically calculated within MERMAID—and often more. For each method, MERMAID provides average values and standard deviations per sample event to help you assess variability across your data.
Method | Metric summaries |
Benthic PIT, LIT, and photo quadrat |
|
Fish belt |
|
Bleaching |
|
Habitat complexity |
|
These metrics mirror the summaries you see in MERMAID’s Collect for each sample unit—but also give a more complete, project-level picture in the export file.

Analyzing data with the MERMAID R package
For reproducible workflows, researchers and practitioners can access these same data tables programmatically via the MERMAID R package in R. The package includes tools to:
Retrieve project metadata and raw-level observation data
Access metric summaries at sample event and sample unit levels
Perform automated filtering and analysis
Read more in Using MERMAID R package.
Deleting data and projects
MERMAID allows project Admins to delete both data and entire projects—however, multiple steps are required to ensure accidental deletions are avoided and essential data is protected.
Deleting a sample unit
In MERMAID, deleting sample units depends on who’s collecting the data and whether the data has been submitted.
Unsubmitted sample units
Only the user who originally entered the data can delete unsubmitted sample units—from their own Collecting page.
To delete your own unsubmitted sample unit:
Go to your Collecting page.
Open the sample unit.
Scroll to the bottom and click Delete Record.
In the confirmation modal, click Delete Record again to confirm.
If you are a project admin and need to delete another user's unsubmitted sample unit, transfer the sample unit to yourself from the Users page, then delete it from your own Collecting page.
Submitted sample units
Only project admins can delete submitted sample units. To do so, admins must first move the sample unit to their Collecting page.
To delete a submitted sample unit:
Go to the Submitted tab.
Open the sample unit.
Click Edit sample unit – Move to Collecting.
The sample unit will now appear in your Collecting page.
Open it, scroll to the bottom, and click Delete record.
Confirm deletion in the popup window.
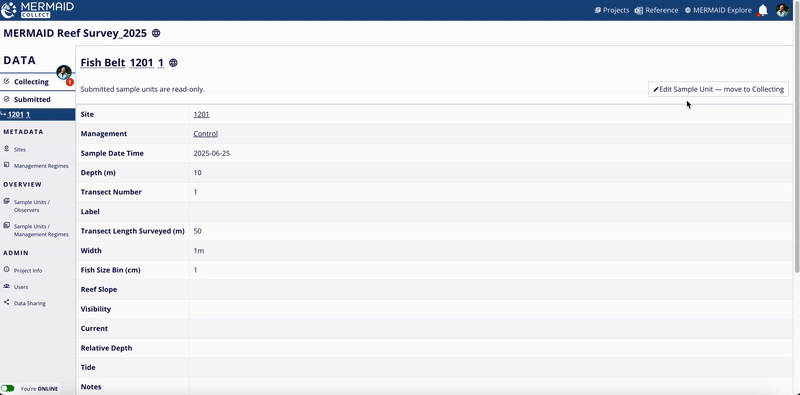
Deleting a project
Removing unused, test, or duplicate projects helps keep your Projects page organized and clutter-free.
When to delete a project
You may want to delete a project if:
It was created for testing or training
It contains no valuable data
It is a duplicate of another project
Important: Deletion is permanent. Deleted projects and data cannot be recovered. Only project Admins can perform deletion. |
Project deletion requirements
To delete a project, you must:
Be an Admin on the project
Remove all users
Delete all submitted and unsubmitted sample units
Only after completing these steps will the Delete project button be available. MERMAID prevents deletion of any project that still contains users or data.
Step-by-step: Deleting a project
1. Remove All Users
Go to the Users page in the project’s sidebar.
Click the Remove from project (red button) next to each user.
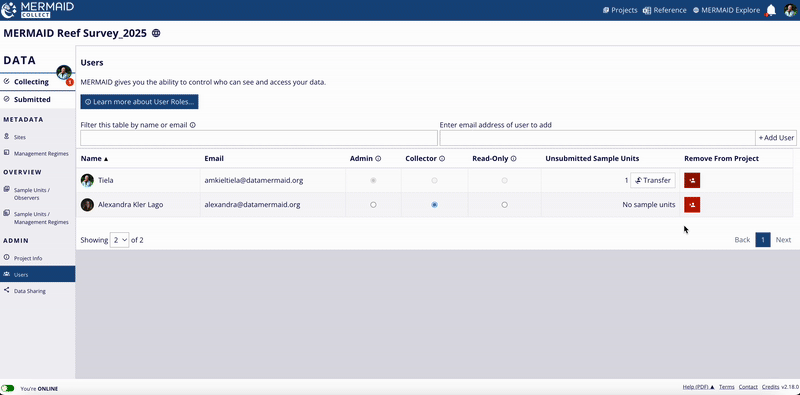
2. Delete All Sample Units
You must delete both:
Unsubmitted sample units from the Collecting page
Submitted sample units from the Submitted page
The deletion process depends on whether you are the original data Collector or a project Admin.
To delete your own unsubmitted sample unit:
Go to your Collecting page
Open the sample unit
Scroll to the bottom and click Delete Record
To delete an unsubmitted sample unit from another user:
Go to the Users page.
Click Transfer next to the original user’s name.
Select yourself or another user who’ll delete them as the new owner.
The transferred sample units will appear in the new owner’s Collecting page.
Open and delete them from there.
To delete a submitted sample unit:
Go to the Submitted tab
Click the sample unit to open it
Click Edit Sample Unit – Move to Collecting
Then follow the same steps to delete it from your Collecting page
Only project Admins can delete submitted sample units.
3. Delete the Project
Once all users and data have been removed:
Go to the Project info page
Click Delete project
In the confirmation modal, click Delete [Project name] to confirm
Using MERMAID Explore
Getting started
Welcome to MERMAID Explore – your interactive window into global reef health data! Explore seamlessly integrates with MERMAID Collect, allowing you to visualize reef health metrics, interact with data through maps and charts, and easily share or export findings.

In MERMAID Explore, while anyone can view public data, logging in with your MERMAID account unlocks the full potential, including accessing your detailed project data and exporting datasets.
Launching MERMAID Explore
You can open Explore in a few ways:
From MERMAID Collect: Click on MERMAID Explore in the top right corner.
From the MERMAID website: Click Discover Explore (or similar button).
Direct URL: https://explore.datamermaid.org
Upon launch, you’ll see the main interface:
Filter panel on the left.
Global interactive map in the center.
Summary metrics and charts panel on the right.
The map, metrics, and charts update dynamically as you apply filters.

Logging in
Viewing public data doesn’t require an account, but to access your detailed project data or export any data, you need to log in.

To Log In: Click the Log In button (top right) and enter your MERMAID account email and password, or use the “Sign up with Google” option if your account is linked.
Already logged into MERMAID Collect? You’re all set! Your session carries over automatically.
New to MERMAID? Click Log In, then choose to sign up using Google or another email.
Navigate Seamlessly: Use the MERMAID Explore button in Collect or the Launch MERMAID button in Explore (top right) to switch between platforms.
Using the interactive map
Explore’s map displays MERMAID survey data globally. Red circles indicate survey clusters.
Navigate: Pan by clicking and dragging. Zoom using the +/- buttons, trackpad, mouse scroll, or by clicking on the red cluster circles.
Site details: Click repeatedly on clusters to zoom down to individual site markers (pins). Clicking on a site marker opens the right-hand metrics panel displaying detailed information about surveys at that specific site. This panel includes:
Site, followed by the Site name.
Below that, the Project section shows the Project name, along with icons to contact project admins and an export icon. Clicking this icon exports a file with project metadata (such as project admins, number of sites and surveys, data sharing policies, etc.) and survey data itself (depending on the data sharing policies). (Note: See the Exporting Data section for details on data export based on filters, across multiple projects and data sharing policies)
The Survey date section lists the relevant date(s).
Two tabs allow you to switch between views:
A Summary tab showing relevant visualizations for that site’s data.
A Metadata tab containing details like Management Regime, Admins (with contact icon), Reef Habitat (Zone, Type, Exposure), Data Sharing status, and the Suggested Citation for the data.
Click on the X in the top-right corner of this panel to close the site-specific view and return to the overall summary metrics and charts.
Map-based metrics (optional): By default, the main summary metrics panel (visible when no specific site is selected) updates based on filters. To update metrics based on the visible map area instead, enable the Metrics update based on map view toggle (looks like a refresh icon ) next to the right-hand panel. Disable it to return to filter-based metrics.
Using the filters
Apply filters using the left-hand panel to refine the data displayed on the map and in the summary metrics. Filtering also determines which data is included when you export.
Basic filters (Countries, Organizations, Projects): Type or select one or more entries from these dropdowns.
Advanced filters: Click Show more filters to access:
Date range: Specify survey start and end dates.
Your data: Check Your projects only to view only projects you have access to (requires login).
Methods/Data sharing: Select specific survey methods and their corresponding data sharing levels.
No data: Include projects that haven’t yet submitted data (useful for project setup checks).
Zoom to filtered data: After applying filters, click the Zoom to filtered data button (looks like a filter) to adjust the map view to encompass only filtered results.
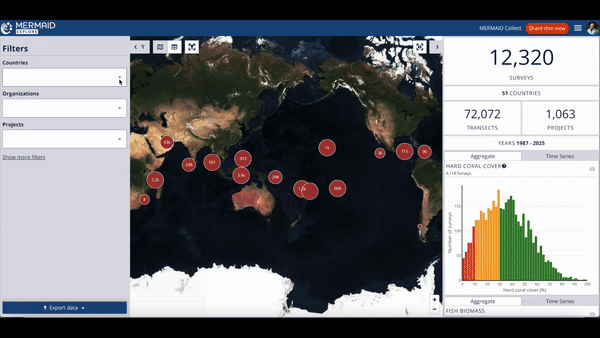
Viewing your project(s) only
There are several ways to focus MERMAID Explore specifically on the projects you have access to:
Using the filter (inside Explore):
Log in to MERMAID Explore.
Click Show more filters in the left-hand panel.
Check Your projects only box under the Your data section. The map and metrics will update to show only your projects.
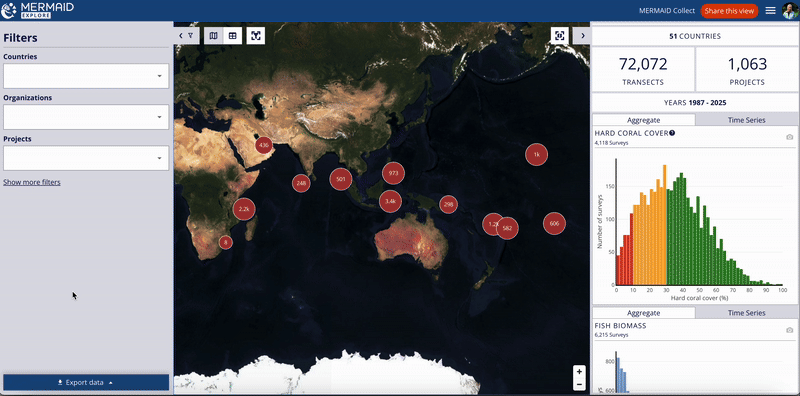
From the Collect projects page (view all your projects):
Log in to MERMAID Collect.
Navigate to the main Projects page where your projects are listed.
Click the globe icon located near the Projects page name. This will open Explore, automatically filtered to show all projects you can access.
From a specific project in Collect (view one project):
Log in to MERMAID Collect and open the specific project you want to view in Explore.
Click the globe icon located next to the project name. This will open Explore, automatically filtered to show only that specific project.
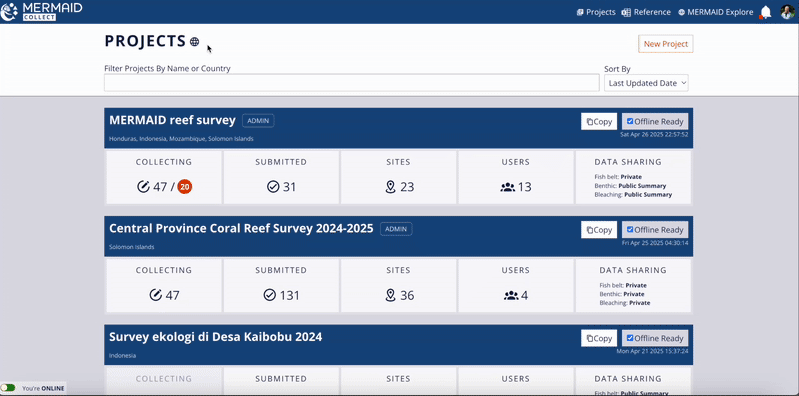
Viewing filtered data in table view
For a tabular summary of your filtered data:
Apply your desired filters.
Click the Table view button (looks like a table icon) at the top left of the map.
The table displays summary information (Project Name, Dates, Countries, Organizations, Survey/Transect counts) for the filtered projects.
To export this summary table, click Export CSV at the top of the table.
Switch back anytime using the Map view button (looks like a map icon
 ).
).
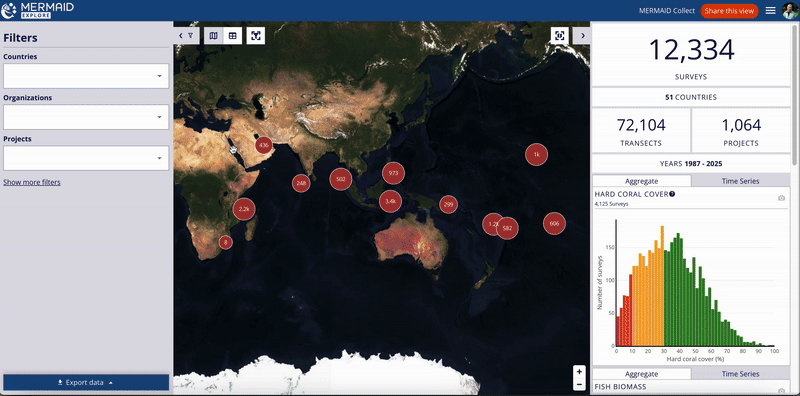
Viewing summary metrics & charts
The right-hand panel dynamically shows overall summary metrics and charts based on your applied filters (or map view, if enabled). (Note: For details on a specific site, click its marker on the map as described in Using the Interactive Map).
Overall metrics: See totals for Surveys, Projects, Countries, Transects, and the Survey Year Range based on your current selection.
Aggregate charts: These charts show the distribution of all surveys within your current selection (filters/map view) across value ranges or categories for key metrics. They provide a high-level snapshot, including surveys conducted at different times within the same site. Aggregate charts include:
Hard coral cover (%)
Fish biomass (kg/ha)
Bleaching severity (categories)
Habitat complexity score (0-5)
Time series charts: These charts specifically show trends over time for key metrics within your current selection, helping you identify changes and patterns. Time series charts include:
Benthic cover (%)
Fish biomass by management regime (kg/ha)
Bleaching severity (categories)
Habitat complexity score (0-5)
Interacting with charts:
Hover: Move your mouse cursor over bars or points on the charts to see exact values or details. For aggregate charts (histograms), hovering over a bar typically shows the specific value range (bin) it represents (e.g., “bin: 28-29.9%”) and the number of surveys in that range.
Download image: Click the camera icon (📷) on any chart to download it as a PNG image, ready for use in reports or presentations.
Important: Summary charts are generated based on data shared as Public or Public Summary. Private data is not included in these overall summary visualizations. |
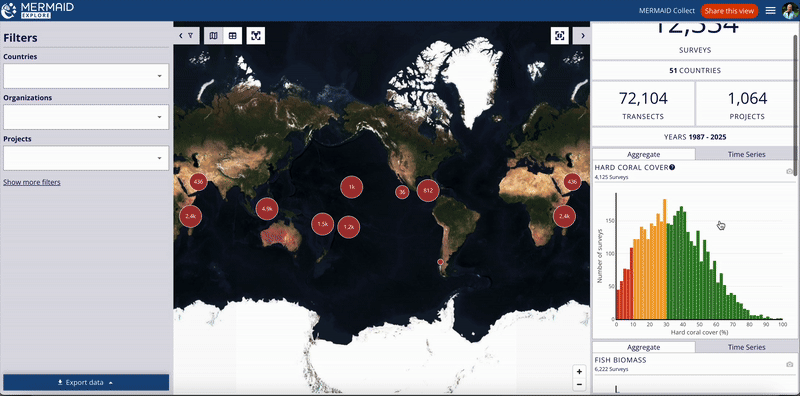
Exporting data
MERMAID Explore allows you to export underlying survey data based on project data sharing policies and your applied filters. A key advantage over exporting from Collect is the ability to export filtered data from multiple projects simultaneously into a single file (per method). Exporting requires you to be logged in.
Apply any desired filters first (the export will reflect these filters).
Click the Export data button on the bottom left panel.
Explore displays a table showing the data available for export for each survey method based on your filters.
Select each desired method individually for export.
Click Send email with link.
Check the email associated with your MERMAID account for a message containing a secure export link. Click the link to download the data file(s).
(Note: Data is provided in Excel format, consistent with MERMAID Collect exports. You may receive multiple files if your selection includes data with different sharing policies, e.g., one file for 'Public' observation data, another for 'Public Summary' data, and a third with metadata only for ‘Private’).
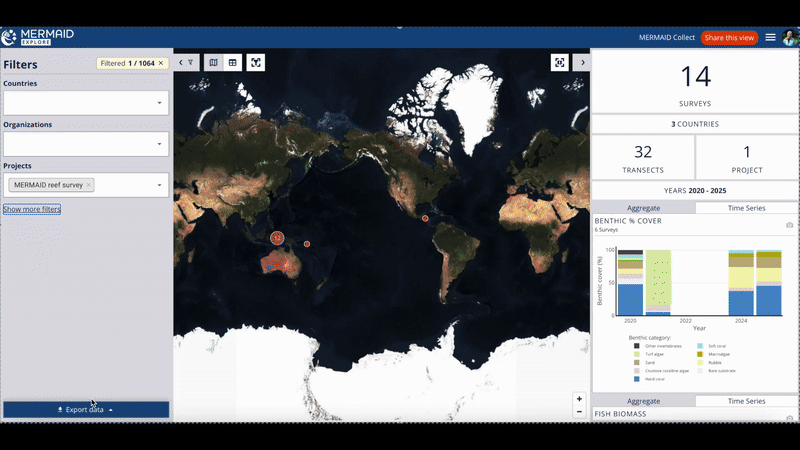
Exporting GFCR data
MERMAID supports the Global Fund for Coral Reefs (GFCR) monitoring.
To export GFCR Fund Indicator data (Targets/Reports):
Use the main filter panel and select "Global Fund for Coral Reefs" or "GFCR" under Organizations.
Select the project(s) you want to export data from under Projects.
Click the Export data and select GFCR data.
A list of relevant GFCR projects appears.
Click Send email with link to receive the Fund Indicator data export.
To View/Export GFCR project reef health data:
Use the main filter panel and select "Global Fund for Coral Reefs" or "GFCR" under Organizations.
The map and metrics will update to show only GFCR projects.
Follow the standard data export process described above (click Export data, select methods, etc.) to export the reef health data for these filtered projects based on their data sharing policies.
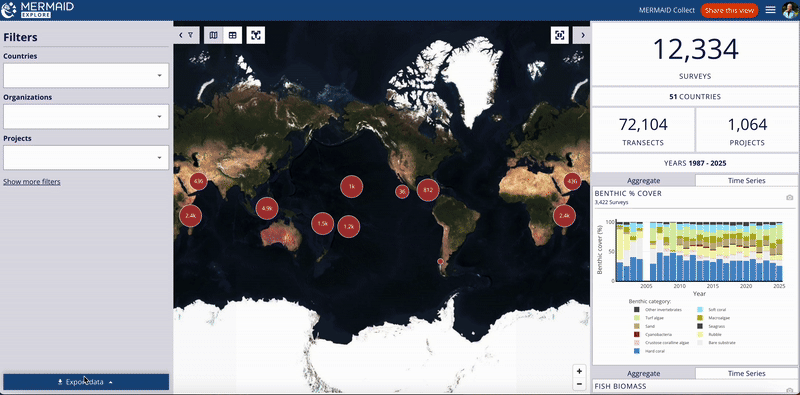
Sharing & collaborating
Easily share your current view of Explore (including applied filters) with collaborators:
Click Share this view in the top-right corner of the page.
A unique URL reflecting your current filters and map view is generated.
Click Copy to copy the link to your clipboard.
Share this link with colleagues. They can open it to see the exact same view. (Note: They will need to log in themselves to export any data).
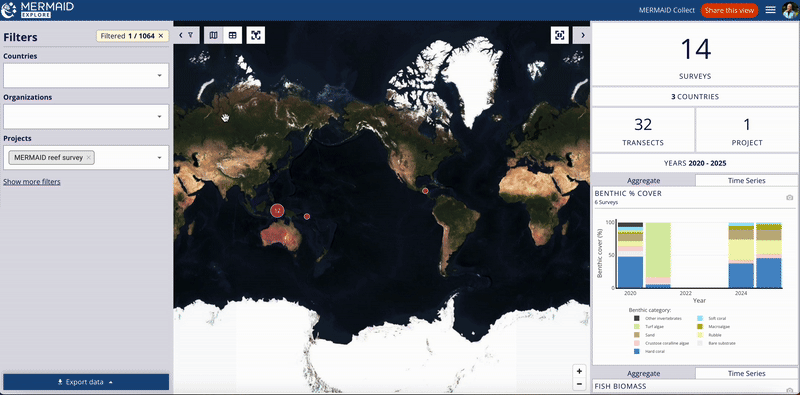
Using MERMAID R package
Getting started
The MERMAID R package (mermaidr) is designed to help you and collaborators efficiently access, analyze, and import coral reef monitoring data from the MERMAID platform—directly within the R environment. Whether you're working with large datasets across multiple sites, conducting advanced analyses, or integrating legacy data into your ongoing monitoring data, mermaidr streamlines your workflow.
What can you do with this R package
With mermaidr, you can:
Access and export your project data from MERMAID for custom analysis.
Compile datasets from multiple projects or survey years.
Import historical or legacy datasets into your MERMAID projects.
Validate your data against MERMAID templates before import.
Leverage ready-made analysis code templates from the MERMAID analysis hub.
These features make mermaidr a valuable tool for those in the MERMAID community conducting analysis, as well as those seeking a smooth path for integrating their datasets into one platform.
Software requirements
Before you begin, ensure that you have R and RStudio installed on your computer.
Download R: https://cran.rstudio.com/
Download RStudio: https://posit.co/download/rstudio-desktop/
These programs provide the environment in which you will run the package mermaidr.
Installing mermaidr
Open RStudio. In the Console panel (bottom left by default), or in a new script file (top left), install the package mermaidr directly from GitHub:
#install package from GitHub
install.packages("devtools")
devtools::install_github("data-mermaid/mermaidr")
# or use the "remotes" package to install mermaidr
remotes::install_github("data-mermaid/mermaidr")
Then load the package:
#load package
library(mermaidr)
Visit the package website for detailed documentation, function references, and tutorials.
For a full list of available functions: Function reference
Authentication and access requirements
To access projects you have access to in mermaidr, you must authenticate your session. For this, you will need a verified MERMAID account. You can sign up for free at app.datamermaid.org.
When you call a project data access function (e.g, mermaid_get_my_projects()), a browser window will automatically open prompting you to log in with your MERMAID credentials (either using Google sign-in or your username and password – however, you normally log in). Once authenticated, the package stores a temporary access token to authorize your session. Just close your browser window and return to R once authentication is completed.
Note: Authentication is valid for 24 hours. After that, you will need to log in again when running a new function. The package handles the expiration for you, so just log in again when prompted. |
You can access:
Your own projects — all MERMAID projects that you are part of (authentication needed)
Public projects — projects with data sharing policies set to public or public summary (no authentication needed)
This dual access allows you to:
Analyze your own project’s data
Aggregate data from across projects, sites, or countries
Conduct regional comparisons
Perform global syntheses using open-access coral reef data
Useful resources
Accessing project data from MERMAID
Accessing your project data from MERMAID using mermaidr is an easy four-step process.
Step 1: Retrieving your projects
To retrieve your projects, use the mermaid_get_my_projects() function.
#load your projects - starts authentication if needed
my_projects <- mermaid_get_my_projects()
When this function is run:
A browser window will open (if it is your first time using mermaidr or have not been using it for the last 24 hours)
Enter your MERMAID credentials
You’ll receive a confirmation message: Authentication complete. Please close this page and return to R.
Return to RStudio and your session will be authenticated
This will retrieve all projects that you are part of either as an Admin, Collector or Read-only user.
By default, all your test projects are not included when running this mermaid_get_my_projects() function.
If you want to also retrieve your test projects, run this function instead:
#load your projects, including test projects
my_projects <- mermaid_get_my_projects(include_test_projects = TRUE)
This will retrieve all projects, including test projects that you are part of.
Step 2: Viewing Your Projects
Once loaded, you can view your projects in a table using:
#view your projects as a table
View(my_projects)
#or print your projects in your console
print(my_projects)
This will open a table showing a list with:
Project IDs and names
Countries
Number of sites
Organization tags
Notes
Data sharing policies
Creation/update dates
Step 3: Filtering your projects
You can filter or group your projects (my_projects object) using the filter function in the package dplyr.
#install dplyr package if you need to
install.package(dplyr)
#load dplyr package
library(dplyr)
#filter projects by country
indonesia_projects <- my_projects %>%
  filter(countries == "Indonesia")
You can filter by:
Country
Project name or ID
Year
Survey method (e.g., Fish Belt, Benthic PIT)
Organization tags
Alternatively, use mermaid_search_my_projects() to search more directly:
#search your projects by country
indonesia_projects <- mermaid_search_my_projects(countries = "Indonesia")
You can also combine queries to narrow down your search:
#search your projects by country and organization tag
WCS_indonesia_projects <- mermaid_search_my_projects(countries = "Indonesia", tags = "WCS Indonesia")
This makes it easy to compile datasets for multi-site or regional analyses.
Step 4: Getting data from projects
Once you have your filtered list of projects, you can retrieve their data using:
#get fish belt observation data for filtered projects
indonesia_projects %>%
  mermaid_get_project_data(method = "fishbelt", data = "observations")
This command will display all raw observations for the specified method–in this example Fish Belt– across your filtered projects. You can specify one or multiple survey methods, and retrieve data for various levels of aggregation.
You can specify the following survey methods:
“fishbelt”= Fish Belt“benthicpit”= Benthic PIT“benthiclit”= Benthic LIT“benthicpqt”= Benthic Photo Quadrat“bleaching”= Bleaching“habitatcomplexity”= Habitat Complexity
And choose the level of aggregation:
"observations"= Raw observations"sampleunits"= Sample unit-level averages"sampleevents"= Sample event-level summaries
To combine different methods and levels of data aggregation:
#get fish belt and benthic pit data for filtered projects at sample unit and sample event levels
indonesia_projects %>%
  mermaid_get_project_data(method = c("fishbelt", "benthicpit"), data = c( "sampleunits", "sampleevents")
This will display all combined data for the methods specified–in this example Fish Belt and Benthic PIT– averaged at the sample unit-level and sample event-level.
Learn more about how to access your projects data in our GitHub documentation: Accessing project data
Access publicly available data in MERMAID
In addition to your own projects, you can access and analyze summary data at the sample event-level from all projects that have been made publicly available in MERMAID by other users.
This doesn’t require authentication.
Use the following functions to retrieve public projects and get sample event-level data directly in R:
#retrieve all publicly available projects in MERMAID

all_projects <- mermaid_get_projects() #you can also apply filters here

all_projects <- mermaid_search_projects()


#get sample event data for all publicly available projects

all_projects_summary_data <-mermaid_get_summary_sampleevents(limit = NULL) #you can also apply filters here
You can also apply filters here following the same procedures as in Steps 3 and 4.
Start your analysis
Once you’ve accessed your data in MERMAID, you can begin your analysis.
To get a quick start, use the ready-made analysis templates available in the MERMAID analysis hub.
Useful resources
Importing legacy data into MERMAID
Have existing data from past surveys in spreadsheets? You can import these directly into MERMAID using mermaidr to have all your past and present data in one platform.

Step 1: Set up a project in MERMAID Collect
Set up a new project in MERMAID Collect (or check that you have an existing project ready for the data import):
Add your organization(s).
Add users and assign their roles.
Set the data sharing policies.
Add sites and management regimes associated with the data you are importing.
If using an existing project, ensure you are an Admin of that project.
Read more in Setting up a project.
Step 2: Download the MERMAID data template in R
Install and load the R package mermaidr in RStudio. Read more in Getting started with the MERMAID R Package.
Load your project to import data using the function
mermaid_get_my_projects(). You’ll need to authenticate using your MERMAID credentials.Load the MERMAID data template for the survey method you need using the function
mermaid_import_get_template_and_options(). Use the survey method syntaxes as listed in Accessing project data from MERMAID. More information about this function can be found here.
Step 3: Reformat your data to match the template
Load your data and sample event spreadsheets (including your sites, management regimes and survey dates) as a CSV file using
read.csv().If your data are separated between the observations and the site characteristics (e.g., site, names, management regimes, survey dates, observers, etc), join these two datasets together by the site name using the
left_join()function.Reformat your data spreadsheet to match the selected MERMAID data import template.
Mandatory fields are marked with an asterisk (*) in the template and these fields must be present in your spreadsheet as individual columns with the exact same name and required field options. These fields cannot be blank.
Non-mandatory columns can be blank or even removed from your data spreadsheet.
Mutate any values in your data spreadsheet to match the available options in specific fields in the template
Step 4: Address errors and warnings
Check for errors and warnings using
mermaid_import_check_options(). You’ll need to check the columns one by one to ensure data is accepted by the MERMAID template and fix any issues. This function will compare the information in the MERMAID template to the information in your data. More information about this function can be found here.
Step 5: Import data to MERMAID
Once all checks are done, import the dataset with
mermaid_import_project_data().First do a dry run (
dryrun=TRUEin the function), then do the real import (dryrun=FALSEin the function). More information about this function can be found here.
Step 6: Validate and submit data in your project
Once your data has been imported into your project in MERMAID Collect, it’ll appear in your Collecting page as individual sample units.
Validate and submit each sample unit, following the standard procedure for data validation and submission. Read more in Saving, validating and submitted Data.
Alternatively, you can validate, submit and edit all sample units at once in R using the following functions:
mermaid_import_bulk_validate(),mermaid_import_bulk_submit(),mermaid_import_bulk_edit().
For more information, access the links: Bulk validation function, Bulk submission function, Bulk edits
Once submitted, sample units become available to all project’s users in the Submitted page.
Detailed guide and import example
Download the data import guide: Step-by-step data import guide (PDF)
Example of fish belt data import: Ingesting historical fishbelt data
Important: Use this workflow only for legacy/archival data or photo quadrat data from CPCe and other software. For ongoing surveys, we recommend entering your observations directly in a project in MERMAID Collect. |
Are you new to R?
If you’re new to programming in R, we recommend:
R users guide for MERMAID – a quick-start guide designed for MERMAID users.
Seascape models R courses – a free training in R using marine ecological data.
Start with: Cleaning ecological survey data for conservation scientists
These resources will build your confidence using R while helping you work with familiar marine datasets.
Useful resources
Importing photo quadrat data into MERMAID
Getting started
MERMAID Easy PQT is a user-friendly Shiny app designed to help you import photo benthic quadrat data annotated in CoralNet or ReefCloud into MERMAID—without requiring any coding in R.
If you're not comfortable using the MERMAID R package mermaidr, Easy PQT is an excellent alternative. It streamlines the process and guides you through each step, ensuring your data is correctly formatted and imported.
Before using MERMAID Easy PQT, you’ll need a verified MERMAID account. See Getting Started.
Note: With MERMAID Easy PQT, only project admins can import data into projects in MERMAID Collect, and test projects / demo projects won’t appear in the projects’ list. |
Step-by-step workflow

Importing CoralNet data into MERMAID
Have photo quadrat data annotated in CoralNet? You can import these directly into MERMAID using Easy PQT to have all your data in one platform.
Important: Make sure that your project is not a test / demo project and that you are an Admin of that project. |
Steps to import your CoralNet data to MERMAID

Step 1: Prepare your project in MERMAID Collect
Before importing data, your project needs to be set up in MERMAID Collect:
Set up a new project (or check that you have an existing project ready for the data import):
Add your organization(s).
Add users and assign their roles.
Set data sharing policies.
Add sites and management regimes associated with the data you are importing.
Read more in Setting up a project.
Step 2: Export Data from CoralNet
Export your data from CoralNet using the steps below:
Make sure you are using the auxiliary fields that include: Site, Management regime, and Transect number (names can be customized). If you haven’t used the auxiliary fields, you need to set them up in your CoralNet project (more info on how to add auxiliary fields can be found in the Calcification Metrics in CoralNet help page under the Different Table for Different Images section.
Navigate to your CoralNet project > Images > Image Actions > Export Annotations, CSV.
Select the label format Both to include the short codes and ID numbers. MERMAID will refer to the ID numbers to assign the right MERMAID benthic attribute and/or growth form for each of your labels.
Include optional columns: Image metadata – date and auxiliary fields.

Step 3: Open MERMAID Easy PQT
Navigate to the MERMAID Easy PQT
Easy PQT will prompt you to authenticate using your MERMAID credentials.
After login, choose CoralNet as the provider you used to annotate your photos, then a list of your active projects will be displayed under MERMAID Project.
Note: Only non-test or demo projects will appear in the Select a project dropdown. |
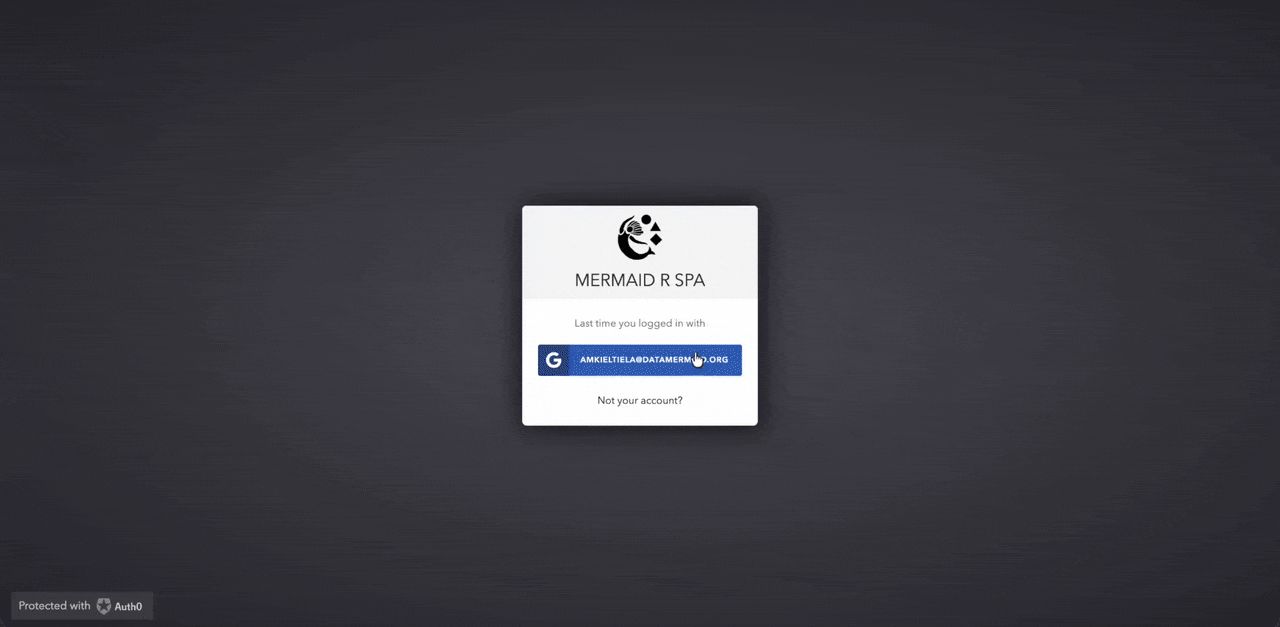
Step 4: Upload exported file
Select the project you want to import your data into.
Upload your file by clicking Browse or drag and drop your file into the upload modal. Only a CSV file exported from CoralNet will be readable by Easy PQT.
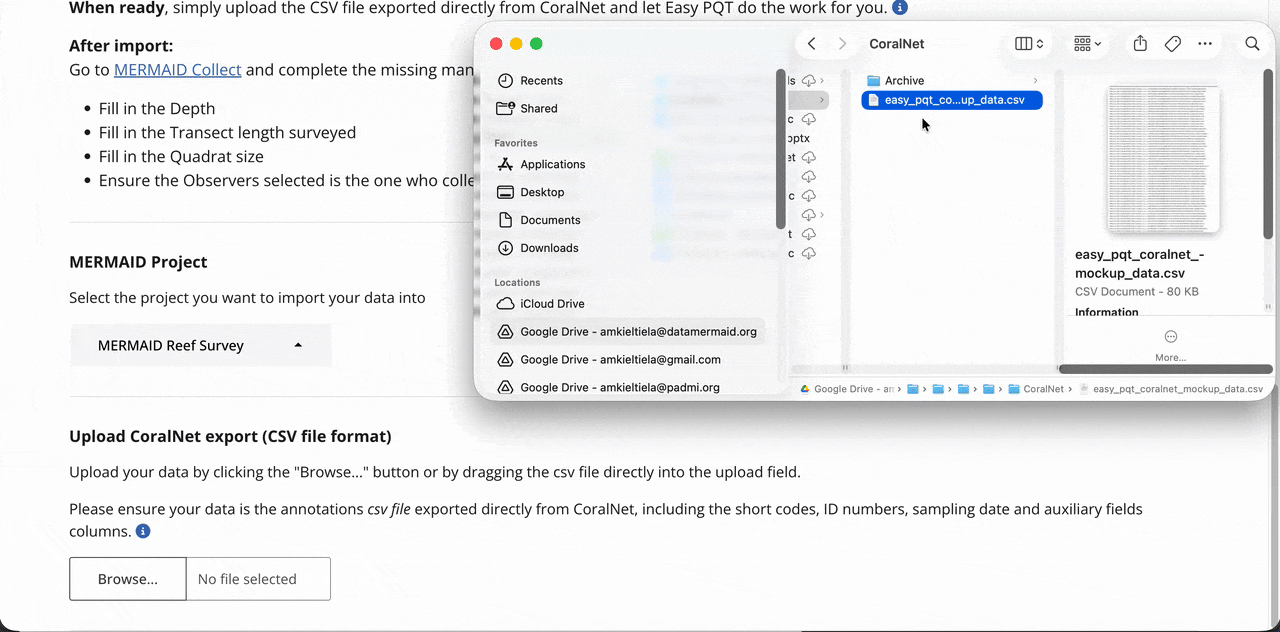
Step 5: Match auxiliary fields
Match your CSV’s auxiliary columns with Site, Management, and Transect values in your MERMAID project.
Easy PQT will validate your entries and highlight any mismatches with guidance.

Step 6: Assign CoralNet labels to MERMAID benthic attributes
MERMAID Easy PQT automatically assigns CoralNet labels to MERMAID benthic attributes and/or growth forms.
Any unassigned values appear in red at the top of the table. Click in each cell and type or use dropdowns to assign the correct benthic attribute and/or growth form.
Notes: You can leave the MERMAID Growth form column empty, but the MERMAID benthic attribute is a required field. |
Once all of your labels are assigned and reviewed to valid MERMAID benthic attributes, you can click the Confirm button to continue the importing process.
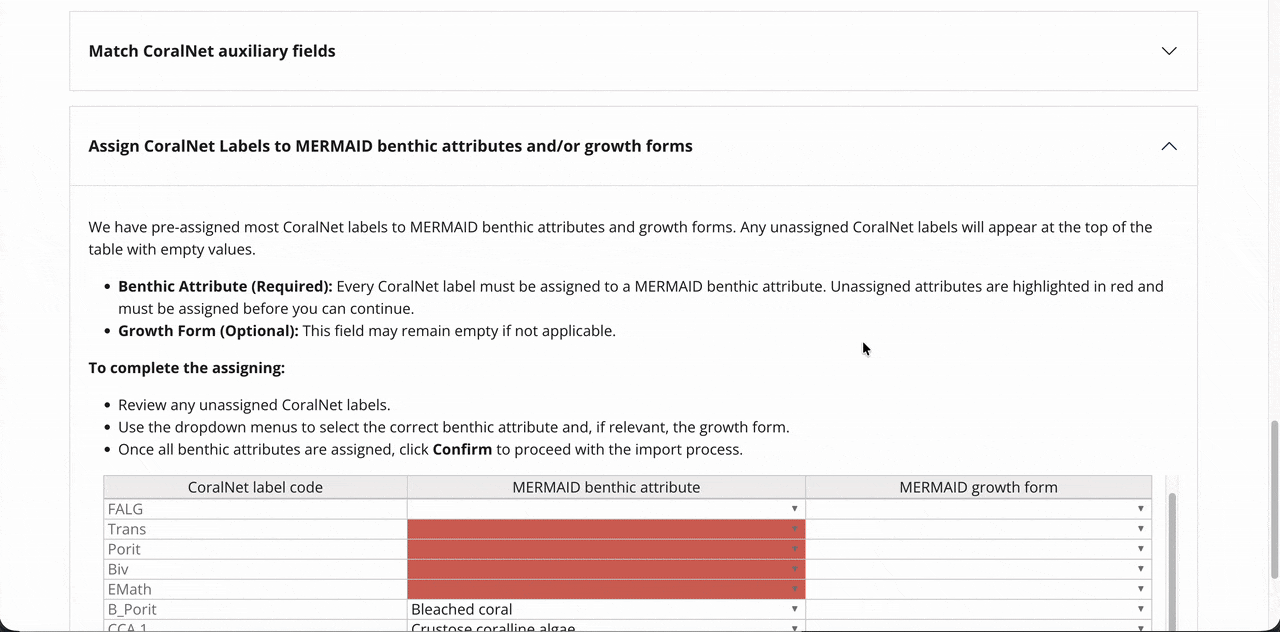
Step 7: Review and import data into MERMAID
Once your data is reshaped and validated, click Import data.
Alternatively, you can restart by clicking on the Restart Easy PQT button or get help by clicking on the Get Help button if something doesn't look right.
You can also download the reshaped dataset as a CSV by clicking on Download reshaped data on the top right of the table.
Once the importing process is complete, you’ll receive a confirmation message on your screen: Import successful!
You can either close the window or scroll to the bottom and click on Go to MERMAID Collect to finalize the import process in MERMAID Collect.
Note: The reshaped dataset will still have missing values (i.e., depth, transect length, and quadrat size) that you will need to complete in MERMAID Collect. Export the complete and clean dataset through the Submitted page in your project. |
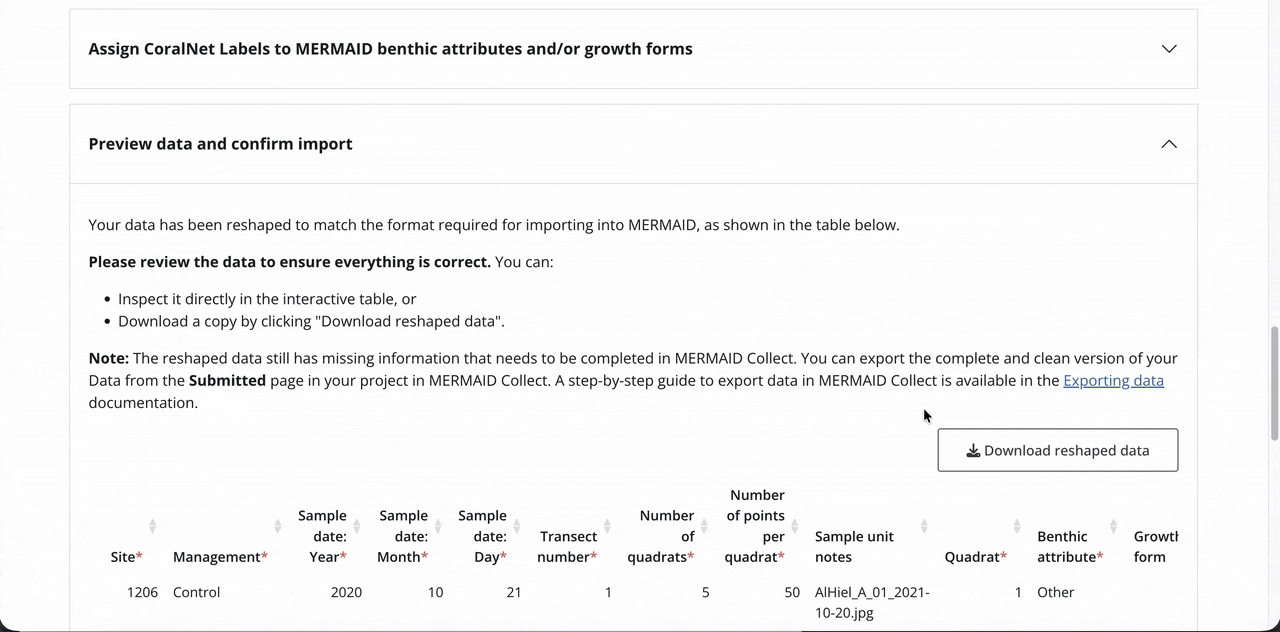
Step 8: Complete sample units in MERMAID Collect
Go to your Collecting page in your project.
Complete required fields: depth, transect length, and quadrat size.
Verify observer info. MERMAID will automatically assign you as the observer. You can change the observer if someone else collected the data.
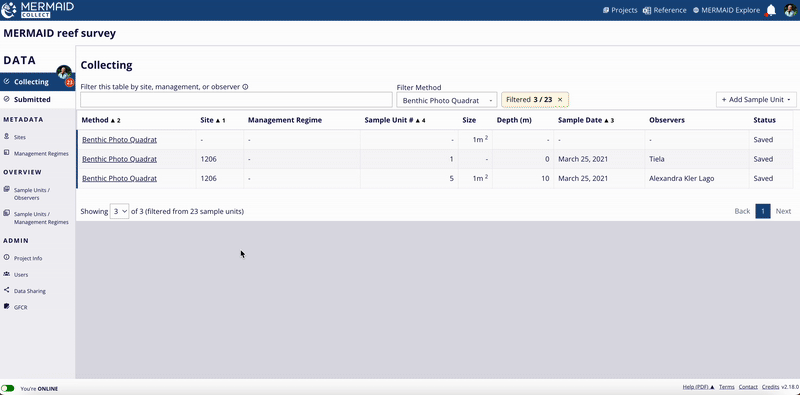
Validate each individual sample unit.
Submit each validated sample unit.
Once submitted, sample units become available to all project’s users in the Submitted page.
Note: Imported data appears under your account in your personal Collecting page of the assigned project. If needed, a project Admin can transfer all sample units to another user via the project’s Users page. Read more about transferring sample units in Editing Data. |
Do you prefer a code-based workflow in R?
For R users, see Importing Legacy Data into MERMAID.
Importing ReefCloud data into MERMAID
Have photo quadrat data annotated in ReefCloud? You can import these directly into MERMAID using Easy PQT to have all your data in one platform.
Important: Make sure that your project is not a test / demo project and that you are an Admin of that project. |
Steps to import ReefCloud data into MERMAID

Step 1: Prepare your project in MERMAID Collect
Before importing data, your project needs to be set up in MERMAID Collect:
Set up a new project (or check that you have an existing project ready for the data import):
Add your organization(s).
Add users and assign their roles.
Set data sharing policies.
Add sites and management regimes associated with the data you are importing.
Read more in Setting up a project.
Step 2: Export data from ReefCloud
Export your data from ReefCloud using the steps below:
Navigate to your ReefCloud project > Export point classifications.
Scroll down and uncheck the “Only Include Human Annotatable Points” option (checked by default), if necessary, or leave it as is.
Click Export. An email with a link to download the zip file will be sent to your registered email address.
Important: You can leave the “Only Include Human Annotatable Points” checked (default) to download the human annotatable points only, or uncheck it if you want to download the human- and machine-annotatable points. Learn more in Export your ReefCloud data. |

Step 3: Open MERMAID Easy PQT
Navigate to the MERMAID Easy PQT
Easy PQT will prompt you to authenticate using your MERMAID credentials.
After login, choose ReefCloud as the provider you are using to annotate your PQT data, then a list of your active projects will be displayed under MERMAID project.
Note: Only non-test or demo projects will appear in the Select a project dropdown. |
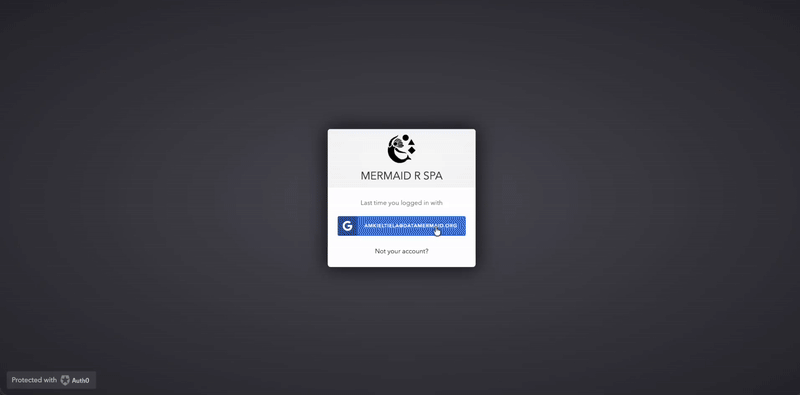
Step 4: Choose the points you want to include
Choose:
“Yes, include human-annotated points only” - if your data contains only the human-annotated points, or
“No, include human- and machine-annotated points” - if your data contains both human- and machine-annotated points (the total number of points per quadrat will always be 50 points)
Learn more about point sampling in Set up your project in ReefCloud, under the “Defining your point sampling approach” section.
Important: MERMAID Easy PQT will prioritize human annotations (from the “Point Human Classification” column). If these are missing, we will use the machine annotations (from the “Point Machine Classification” column) instead. |
Step 5: Upload exported file
Select the project you want to import your data into.
Upload your file by clicking Browse or drag and drop your file into the upload modal. Only a ZIP file exported from ReefCloud will be readable by Easy PQT.
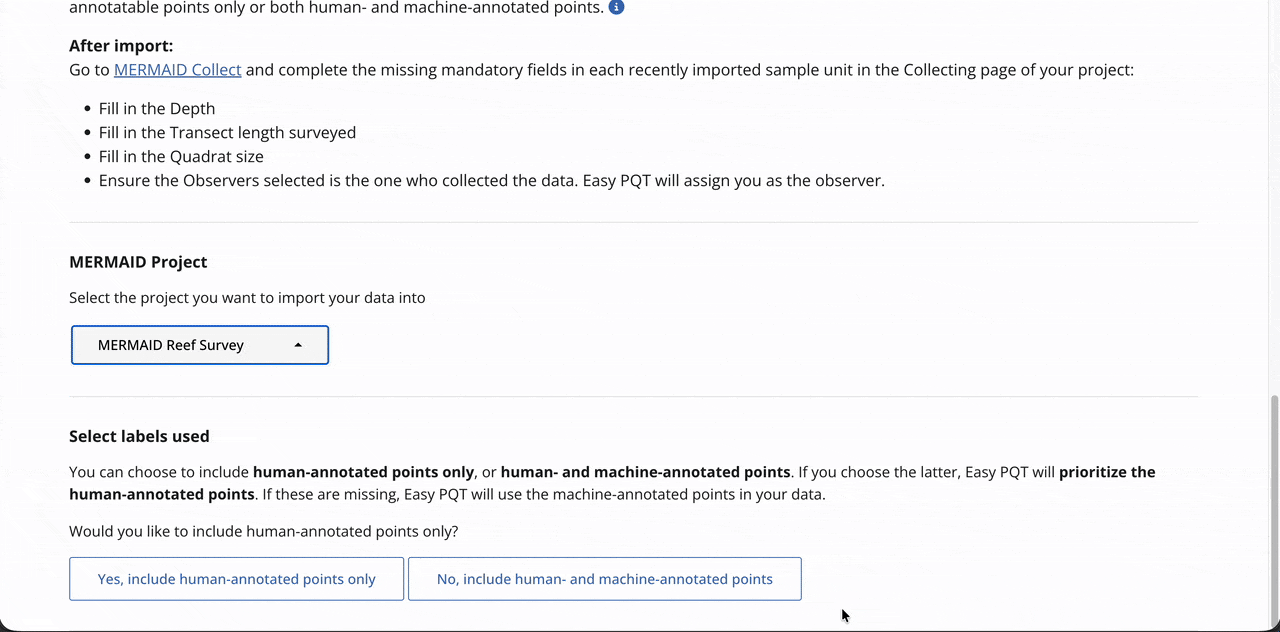
Step 6: Assign ReefCloud labels to MERMAID benthic attributes
MERMAID Easy PQT automatically assigns ReefCloud labels to MERMAID benthic attributes and/or growth forms. Human annotations take priority (from the “Point Human Classification” column). If these are missing, then the machine annotations (from the “Point Machine Classification” column) will be used instead.
Any unassigned values appear in red at the top of the table. Click and type or use dropdowns to assign the correct benthic attribute and/or growth form.
Note: You can leave the MERMAID growth form column empty, but the MERMAID benthic attribute is a required field. |
Once all of your labels are assigned and reviewed to valid MERMAID benthic attributes, you can click Confirm to continue the importing process.
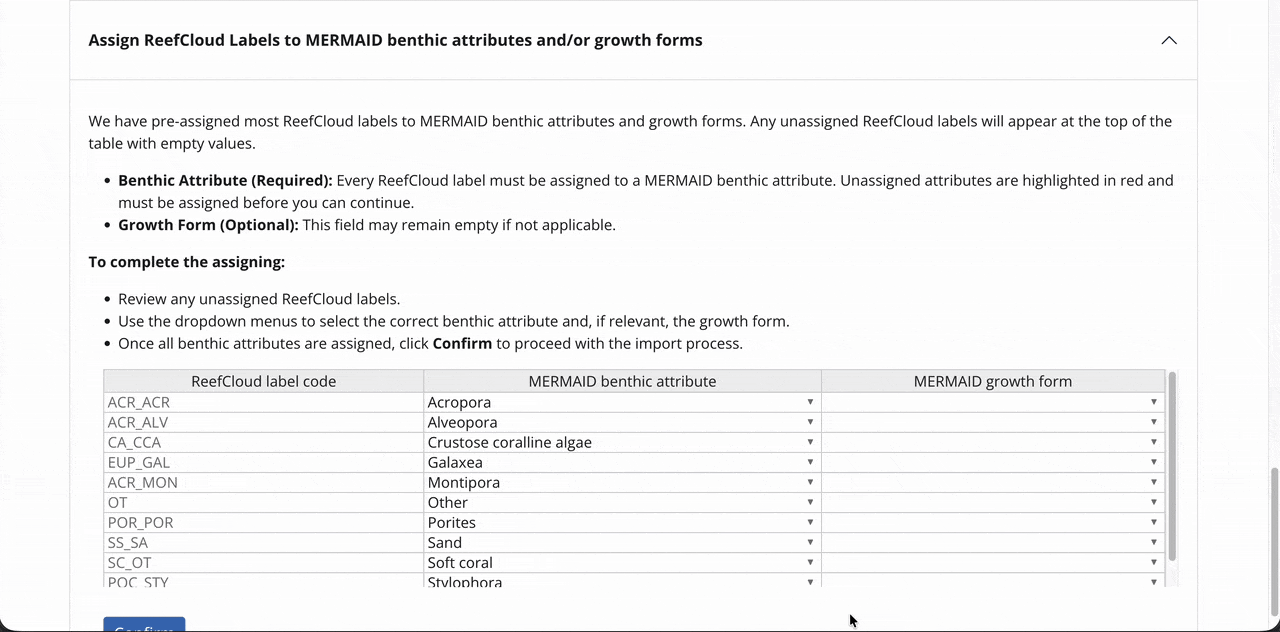
Step 7: Review and import data into MERMAID
Once your data is reshaped and validated, click Import data.
Alternatively, you can restart by clicking on the Restart Easy PQT button or get help by clicking on the Get help button if something doesn't look right.
You can also download the reshaped dataset as a CSV by clicking on Download reshaped data on the top right of the table.
Once the importing process is complete, you’ll receive a confirmation message on your screen: Import successful!
You can either close the window or scroll to the bottom and click on Go to MERMAID Collect to finalize the import process in MERMAID Collect.
Note: The reshaped dataset will still have missing values (i.e., depth, transect length, and quadrat size) that you will need to complete in MERMAID Collect. Export the complete and clean dataset through the Submitted page in your project. |

Step 8: Complete sample units in MERMAID Collect
Go to your Collecting page in your project.
Complete required fields: transect length and quadrat size.
Verify observer info. MERMAID will automatically assign you as the observer. You can change the observer if someone else collected the data.
Validate each individual sample unit.
Submit each validated sample unit.
Once submitted, sample units become available to all project’s users in the Submitted page.
Note: Imported data appears under your account in your personal Collecting page of the assigned project. If needed, a project Admin can transfer all sample units to another user via the project’s Users page. Read more about transferring sample units in Editing Data. |
Do you prefer a code-based workflow in R?
For R users, see Importing Legacy Data into MERMAID.
Learning about our taxonomic reference
MERMAID provides a centralized and standardized reference for all reef fish species and benthic attributes used in data collection and analysis. These references are validated against authoritative sources to ensure taxonomic accuracy and analytical consistency across the platform.
Taxonomic authority and source integration
MERMAID maintains scientific accuracy by relying on the following authoritative databases:
World Register of Marine Species (WoRMS)
All fish and benthic species names in MERMAID are checked against WoRMS to ensure they are taxonomically valid and accepted. This reduces duplication and ensures naming consistency across projects. MERMAID also uses WoRMS to retrieve geographic distributions for all benthic attributes and reef fish.FishBase
For reef fish species, MERMAID automatically retrieves and regularly updates key ecological and biological attributes from FishBase, including:Geographic distribution (combined with information from WoRMS)
Maximum length (as total length)
Trophic level
Vulnerability to fishing
Climate vulnerability score
Length-weight coefficients (a and b) used to calculate biomass using a Bayesian length-weight model
Download our taxonomic reference file
You can access the full reference list directly in MERMAID Collect, even when offline:
Open MERMAID Collect.
Click Reference in the top-right toolbar.
This will automatically download an XLSX file with the most up-to-date taxonomic references for fish and benthic attributes in MERMAID.
MERMAID’s taxonomic references are updated regularly. To ensure accuracy, always download the latest version before use.

What’s inside the Reference file
The reference file contains 5 worksheets:
Fish families
Fish genera
Fish species
Fish groupings
Benthic
Each sheet provides a standardized, filterable list of valid taxonomic entries and their metadata. These lists are used across MERMAID Collect, Explore, and R package.

Tips for using the Reference file
Use Excel filters in the Parent column:
Select (Blanks) to view only top-level categories
Select a specific parent (e.g., Acropora) to view all related attributes


Proposing new benthic attributes or fish species
The MERMAID taxonomic reference list is continuously expanding, thanks to contributions from users across the community. When users enter observations in MERMAID Collect, they can propose new benthic attributes or fish species that are not yet in the system.
Every proposal is reviewed by the MERMAID team, who verify the name against authoritative databases like WoRMS (for taxonomy) and FishBase (for fish traits and ecological data). Once approved, new entries are added to the reference database and become available to all MERMAID users.
If you notice a species or attribute that’s missing, cross check with the WoRMS database to ensure you’re using the accepted scientific name. If the accepted scientific name is not available in MERMAID, you can easily propose it while adding your data.
Learn how to do this in Adding a sample unit to collect data.

Standard taxonomic hierarchies in MERMAID
MERMAID uses a unified hierarchy structure for fish and benthic data across all tools—Collect, Explore, and the R package mermaidr. This ensures taxonomic consistency, reduces data cleaning, and enables reproducible analysis workflows.
Fish hierarchy
MERMAID rolls up reef fish observations using the following structure:
Species → Genus → Family → Trophic group
e.g., Acanthurus achilles (species)→ Acanthurus (genus) → Acanthuridae (family) → Herbivore (trophic group)
Trophic groupings (e.g., planktivores, piscivores, herbivores) are used for functional diversity and fisheries impact analyses.
When only genus or family is reported, MERMAID uses genus/family-level values from FishBase to compute averaged constants (e.g., for biomass estimation).
Benthic hierarchy
MERMAID uses a similar structure for benthic attributes:
Species → Genus → Family → Top-level category
e.g., Acropora palmata (species) → Acropora (genus) → Acroporidae (family) → Hard coral (top-level category)
The 12 top-level benthic categories used in MERMAID are:
|
|
|
|
|
|
|
|
|
|
|
|
These categories are used to calculate benthic cover composition across sites and projects.
Why this matters for your data
These hierarchies are essential for calculating key reef health metrics such as:
Benthic percent cover
Fish biomass (kg/ha) by family and trophic group
By automatically grouping observations from species to broader ecological categories, MERMAID allows users to generate these metrics even when observations are reported at different taxonomic levels (e.g., genus or family instead of species).

Summary
All fish and benthic taxonomy in MERMAID is validated through WoRMS.
Fish data are dynamically retrieved from FishBase, including biomass and ecological traits.
Propose new species or attributes easily in-app, with validation support.
Use the reference file to explore, filter, and better understand taxonomic groupings.
MERMAID’s standardized taxonomy structure simplifies analysis and supports reproducible science.
Learning about our reef health metrics
MERMAID automatically calculates commonly used reef health metrics that are widely used in coral reef science and management. These metrics summarize your raw field observations into reef fish biomass, percent benthic cover, bleaching severity, and habitat complexity. They are available in MERMAID Collect, MERMAID Explore, as well as in the export XLSX files, and programmatically via the MERMAID R package.
Understanding the MERMAID data hierarchy
All metrics in MERMAID are structured into three levels:
Observation: Individual records (e.g., each fish count for a size class or benthic point). This is your raw data
Sample unit: One transect or survey effort (e.g., one fish belt transect)
Sample event: A site-level aggregation on a given survey date (e.g., all transects in a site on a specific date)

Accessing observations and summary data
Once your data is entered, validated, and submitted in MERMAID Collect, you can export it as a zipped XLSX file. This export file includes separate worksheets for:
Observation data (e.g., individual fish or benthic records)
Sample unit summary (e.g., averages from each transect)
Sample event summary (e.g., site-level averages for a survey date)
You can also access the same data using the mermaid_get_my_projects_data() function in the MERMAID R package mermaidr. Read more in Accessing Project Data.
Fish abundance and biomass
MERMAID calculates both total fish abundance and biomass. Abundance is calculated by summing the count of fish observed for each sample unit. Biomass is calculated using formulas based on FishBase Bayesian length-weight coefficients. MERMAID calculates:
Total biomass (kg/ha) and abundance (individu) for each sample unit
Average biomass (kg/ha) means and standard deviations by:
Sample event
Trophic group (e.g., piscivores, planktivores, herbivores)
Fish family (e.g., Scaridae, Acanthuridae)
Biomass calculation:
MERMAID calculates biomass using the following steps:
Fish biomass (kg/ha) per observation

Total fish biomass (kg/ha) per sample unit by family, and trophic group

Average biomass (kg/ha) per sample event by family, and trophic group. Standard deviations are also included

Benthic cover
MERMAID supports three benthic methods:
Benthic Point Intercept Transect (PIT)
Benthic Line Intercept Transect (LIT)
Benthic Photo Quadrat Transect (PQT)
All benthic observations roll up into 12 top-level benthic categories (e.g., hard coral, macroalgae, soft coral).
Percent cover calculation:
For each method, MERMAID calculates percent cover using the following formulas:

MERMAID also calculates means and standard deviations per category at the sample event level.

Bleaching severity
MERMAID includes a rapid bleaching assessment using quadrats, with bleaching categorized into seven severity categories. Data are entered into two tables:
Colonies bleached calculation:
MERMAID calculates the percentage of colonies in each of the seven bleaching severity categories (i.e., normal, pale, 0-20% bleached, 21-50% bleached, 51-80% bleached, 81-100% bleached, and recently dead) per sample unit:
Average percentage of colonies for each bleaching category per sample unit

Average percentage of colonies for each bleaching category per sample event. Standard deviations for sample events are also included

Percent cover calculation:
MERMAID calculates the average percent cover of hard coral, macroalgae, and soft coral per sample unit and sample event:
Average percentage of hard coral, macroalgae, and soft coral per sample unit. Standard deviations are also included

Average percentage of hard coral, macroalgae, and soft coral per sample event. Standard deviations are also included

Habitat complexity
MERMAID uses the Wilson et al. (2007) method for reef habitat complexity, with scores ranging from 0 (no complexity) to 5 (high complexity).
Average score calculation:
Average score per sample unit. Standard deviations are also included

Average score per sample event. Standard deviations are also included

Want to dive deeper?
For more on how MERMAID generates these metrics, including calculations and taxonomies:
Citing data from MERMAID
Properly citing data is essential, especially when using datasets from projects you are not directly involved with. Correct citation ensures appropriate credit to data collectors and supports data transparency and reproducibility.
Project citation in MERMAID Collect
MERMAID automatically generates a suggested citation for each project. You can find this citation on the Project info page within the MERMAID Collect. It is also included in all exported data files and displayed in the Metadata section of a site view in MERMAID Explore.
Key Points:
|

Citation format
All suggested citations generated in MERMAID follow the same following format:
[Projects admins]. [Date of last update in project]. [Project name]. MERMAID. [URL to project view in MERMAID Explore]. |
How to access and edit the citation
Go to the Project info page inside your project.
Click the Edit Citation button to open the editable citation modal.
Modify the citation text as needed in the Edit Citation field.
When finished, click Update Citation to save your changes.
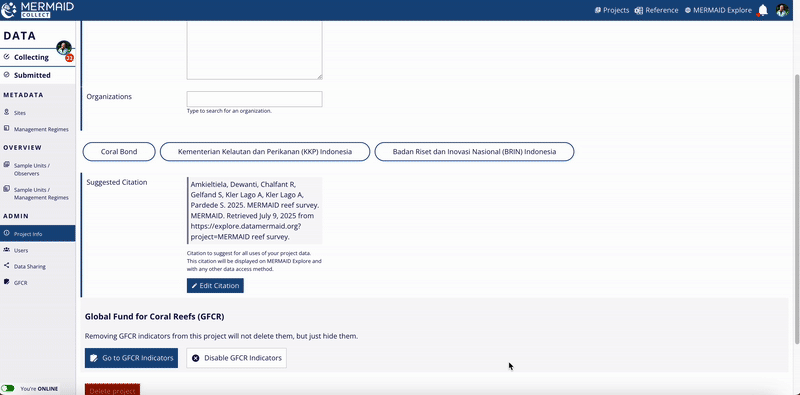
Revert changes
If you want to revert to MERMAID’s original suggested citation after making edits, click the Use Default Citation button located at the upper right of the Edit Citation field.
Remember to click Update Citation after reverting to ensure your choice is saved.
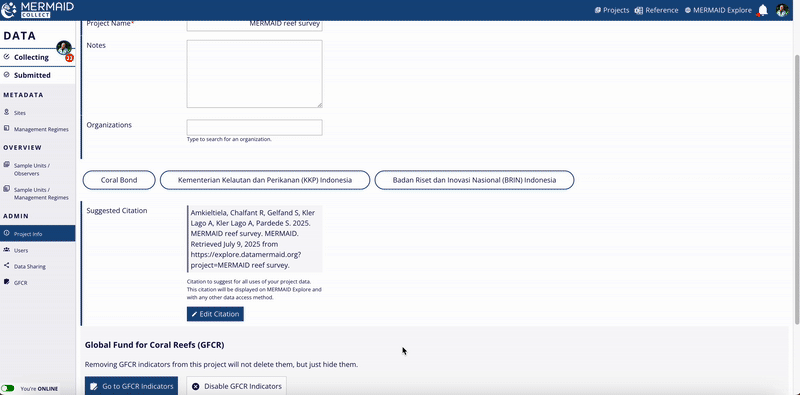
Viewing project citation in exported data files
The project’s suggested citation is always included in the data files exported from MERMAID. In each exported file—whether in the Sample events, Sample units, or Observations tabs—you will find a column labeled Suggested citation containing the current project citation.
This inclusion guarantees that anyone using exported data has clear guidance on how to properly cite the dataset.

Viewing project citation in MERMAID Explore
Users can also view the project’s suggested citation while exploring survey data in MERMAID Explore:
Navigate to the Survey site you want to view.
Open the Metadata tab within the site view on the right metrics panel.
Scroll to the bottom of the Metadata section to find the Suggested citation area.
The citation displayed here reflects the current project citation, as set on the Project info page in MERMAID Collect.
This feature ensures that users accessing data through MERMAID Explore can easily reference the project’s citation for proper acknowledgment.
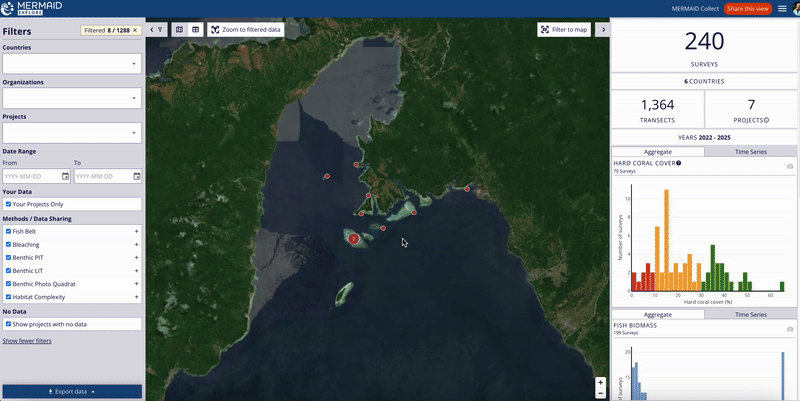
Getting data from MERMAID (via API)
MERMAID provides programmatic access to its entire dataset via an Application Programming Interface (API). This API is the backbone of all MERMAID tools—including MERMAID Collect, MERMAID Explore, and the MERMAID R package mermaidr—and can also be used directly for building custom tools, dashboards, or workflows.
This documentation refers specifically to the production API hosted at: https://api.datamermaid.org/v1/
The API is built on a secure, scalable AWS-based stack, powered by a PostgreSQL database (via Amazon RDS) and developed using Django and the Django REST Framework.
It is actively used by:
All MERMAID code is free and open source, licensed to support transparency, reproducibility, and community-driven development.
Why use the API?
Use the MERMAID API if you want to:
Automate data exports and processing.
Access real-time, up-to-date MERMAID data without manual exports.
Build your own custom visualizations or apps using MERMAID data.
Integrate MERMAID data into third-party software (e.g., ArcGIS, R Shiny, Tableau)
Explore the API Docs
You can find a detailed API documentation, which includes:
A client file guide using Insomnia to test requests
Instructions for authentication using MERMAID login credentials
Resources to browse endpoints
Authentication
All API requests require authentication. You can either:
Use your MERMAID credentials to obtain a token
Or generate an API token (if available to your user type)
Common endpoints for MERMAID projects
Here are some frequently used endpoints related to MERMAID projects:
Observations: All observation in a transect for each survey method:
/projects/<project_id>/obstransectbeltfishs/
/projects/<project_id>/obsbenthiclits/
/projects/<project_id>/obsbenthicpits/
/projects/<project_id>/obscoloniesbleached/
/projects/<project_id>/obsquadratbenthicpercent/
/projects/<project_id>/obshabitatcomplexities/
Sample units: Aggregated metrics at the transect-level for each survey type:
/projects/<project_id>fishbelttransects
/projects/<project_id>/benthictransects/
/projects/<project_id>/quadratcollections/
Sample events: Aggregated metrics at the site/date-level for all survey types:
/projects/<project_id>/sampleevents/
Integration examples
You can use the API in tools such as:
R: via
httr,jsonlite, ormermaidrPython: using
requestsorpandasWeb apps: JavaScript
fetch()or client-side libraries
Learn from our users
How Rare automates data from MERMAID to their dashboard
A standout example of how the MERMAID API is being used comes from Rare, which built an automated pipeline to extract coral reef monitoring data from its Fish Forever projects in MERMAID and feed it directly into their internal dashboard for streamlined analysis and reporting.
What it does:
Extracts data from the MERMAID API for projects tagged with “Rare,” including fish, coral, and photo quadrat data.
Transforms raw data into standardized formats using Python and Pandas, with full data validation.
Loads processed data into a PostgreSQL database, enabling real-time analytics and dashboarding.
Technologies used:
Apache Airflow: for robust, scheduled orchestration (daily at 2 AM)
Python with Pandas: for data transformation
SQLAlchemy: for secure and efficient database communication
Benefits:
Eliminates manual data downloads and prep
Keeps data fresh and analysis-ready with daily updates
Ensures consistency, error handling, and logging across projects
Scales across multiple projects and supports parallel processing
This pipeline is a powerful demonstration of how MERMAID’s API can be used to support data workflows.
This pipeline is available on GitHub, allowing other organizations to adopt or customize it for their own needs.
Related Resources
Need help getting started? Contact the MERMAID support team or explore the API docs to learn more.
Global Fund for Coral Reefs in MERMAID
Are you a GFCR Program? Start here
MERMAID has been selected as the digital platform to support the monitoring and evaluation (M&E) of Global Fund for Coral Reefs (GFCR) Programs.
The GFCR is a blended finance initiative and global partnership designed to mobilize resources and investment for the management, protection and restoration of coral reef ecosystems. It aims to support reef-positive businesses and deliver lasting impact through conservation, restoration, and sustainable development (see Theory of Change).
MERMAID supports GFCR Programs by:
Enabling the collection of baseline data for the 10 core GFCR Fund Indicators (F1–F10) and their 37 associated sub-indicators
Facilitating the tracking of progress against targets through bi-annual reporting and final evaluations (see GFCR Monitoring and Evaluation Toolkit)
Providing tools to generate summaries of coral reef health indicators for use in Program reporting and impact assessment
These capabilities are now fully supported through integrated tools within MERMAID Collect, specifically developed for the GFCR M&E Framework.
Creating targets and reports for GFCR data
As a Convening Agent, you need to first sign up to a MERMAID account, login, then set up a project in Collect for your GFCR Program. You can learn about how to create your MERMAID account and project on Getting Started.
Set up your GFCR project
When creating your project in Collect, use the official name of your GFCR Program followed by a dash (-) and the country name(s) as your Project Name (e.g., Miamba Yetu Program - Kenya & Tanzania).
Once your GFCR project has been created, open your project and go to Project Info under ADMIN on the left-hand menu bar.
Add a short description of your GFCR Program in the Notes field.
Add all organization names (including partner organizations) in the Organizations field. If the organization name is not available in the dropdown options, you can suggest a new organization name to MERMAID. Read more in Setting up a new project. Remember to include Global Fund for Coral Reefs in Organizations. This is important for locating all GFCR Programs in MERMAID Explore.
If you need to add other users that will enter ecological data or sets of Fund Indicators in the GFCR project, or that simply need to visualize data, go to Users under Admin and add users by entering their email address. You may change the role of each user inside this page between admin, collector or read-only, according to type of permissions they need. Learn more in Setting up a new project.
Note: Only Admin users can create, edit and delete GFCR reports and targets. Make sure to check each user's role to confirm they have the right permissions. |
Enable the GFCR Indicators
GFCR Fund Indicators can be enabled by a single click inside your GFCR project.
To access the GFCR page and create reports for Fund Indicators, you must first enable the GFCR Indicators by clicking the Enable GFCR Indicators for this project button on the Project Info page under the ADMIN section.
After you click the button, a GFCR page will appear under the ADMIN section on the left-hand menu bar.
Access this GFCR page by clicking on the Go to GFCR Indicators button from the Project Info page or directly by clicking on the GFCR page under the ADMIN section on the lefthand menu bar.
On this page, you can create new sets of Fund Indicators as targets or reports, visualize them, make changes, and download them.
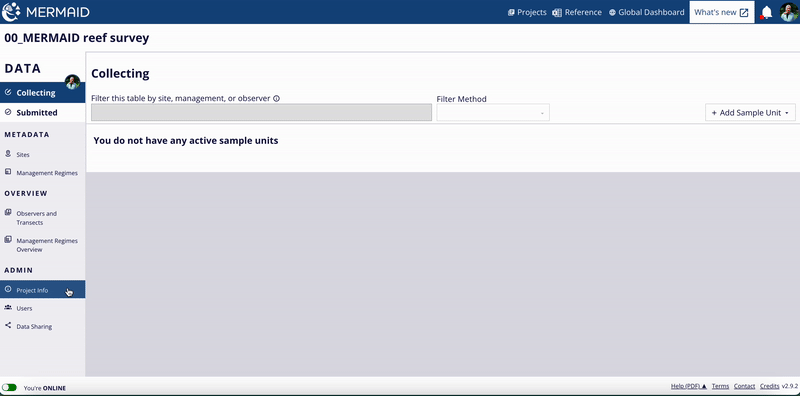
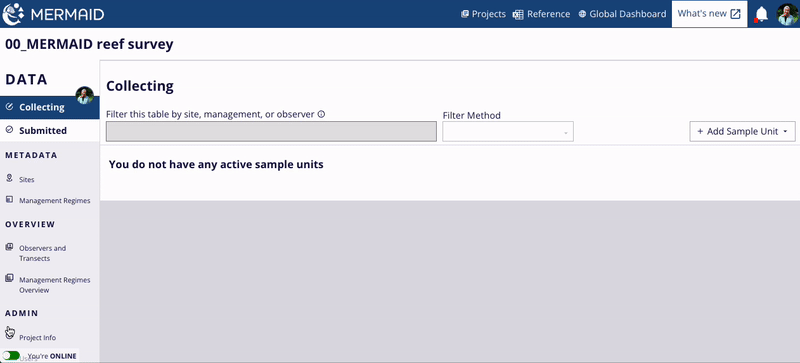
Create your target GFCR Fund Indicators
Important: Each GFCR project should establish three sets of targets for the entire duration of the Program. As new business / finance solutions are added to the Program, these targets can be adjusted accordingly. |
We recommend labelling each set of targets as "Phase 1 Target", "Mid-Term Target" and "Final Target" accordingly.
To create a new set of GFCR Fund Indicators as targets for your GFCR project:
Go to the GFCR page, click on the + Create new button, then select Target.
Fill in the Title and Reporting Date, click on the Create Indicator Set button. Reporting date should should correspond to the end date of the reporting period for specific target.
You will visualize all 10 Fund Indicators (F1-F10) on the sidebar. Inside each section, add the values for each sub-indicator, then click on the Save button on the top-right corner. If the value entered does not match the validation criteria (e.g., number is too large, not an integer number), the Fund Indicator will not be saved. You should verify your entry to ensure it is entered and saved correctly.
You can always make changes to your saved target indicators by selecting the set of targets your want to edit from list on the main GFCR page.
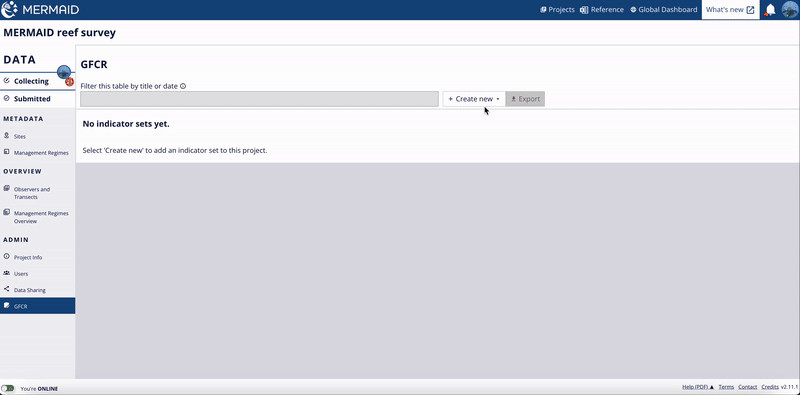
Create a report of GFCR Fund Indicators
Important: Each GFCR Program will have a baseline report followed by bi-annual reports to track progress against established targets. |
We recommend labelling each report as "Baseline," "Mid-Year Report [Year]," or "End-Year Report [Year]" accordingly.
The steps are very similar to creating a target for GFCR Fund Indicators:
Go to the GFCR page, click on the + Create new button, then select Report.
Fill in the Title and Reporting Date, click on the Create Indicator Set button. The reporting date should correspond to the end date of the reporting period for either the baseline or bi-annual report (e.g., for an End-Year Report, the end date is December 31, so you would enter 31/12 followed by the year).
You will visualize all 10 Fund Indicators (F1-F10) on the sidebar. Inside each section, add the values for each sub-indicator, then click on the Save button on the top-right corner. If the value entered does not match the validation criteria (e.g., number is too large, not an integer number), the Fund Indicator will not be saved. You should verify your entry to ensure it is entered and saved correctly.
Note: Even if your GFCR Program does not engage in specific activities related to any indicators, you are still required to report on all of them. If your Program does not engage in the activity, the default values are set to '0', and you may leave them as is if no related activities are being conducted. |
You can always make changes to your saved reported indicators by selecting the report your want to edit from list on the main GFCR page.
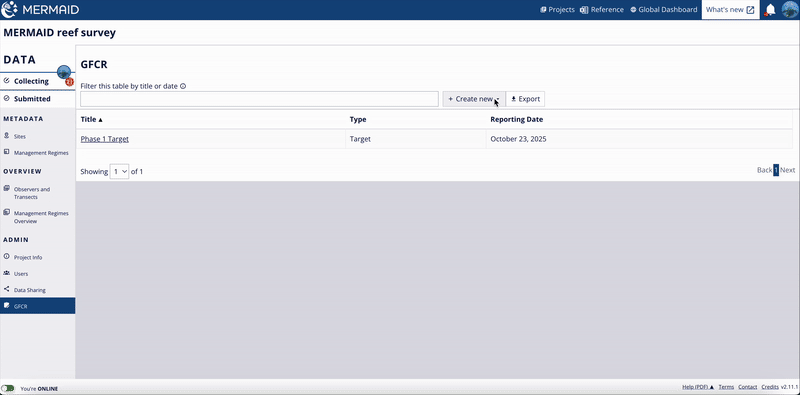
For all Fund Indicators, there is a Notes field where you can add additional information to support the analysis and interpretation of your indicators, as well as for your annual narrative report to be submitted to GFCR.
If you enter a value of '0' for any sub-indicator, please specify in the Notes section whether this represents a true zero (i.e., the sub-indicator is not applicable to your Program) or missing data (e.g., data not yet collected for that sub-indicator).
MERMAID provides help text for each of the 37 sub-indicators to assist you with completing them. Simply click on the tool tip 'i' next to the sub-indicator or click on the Show Help on the top right to show all the help texts for all sub-indicators.
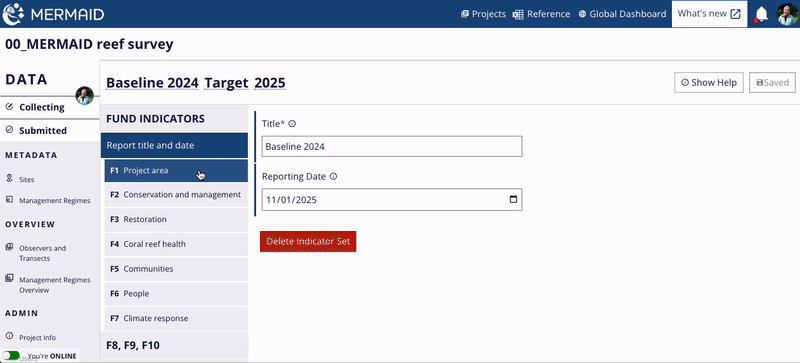
Delete a target or report of GFCR Fund Indicators
To delete a target or report:
Navigate to the GFCR page
Click on the title of the target or report you wish to delete.
In the first section Title and date, click on Delete Indicator Set to remove the selected item.
Important: This action is permanent. Once a report or target is deleted, it cannot be recovered. |
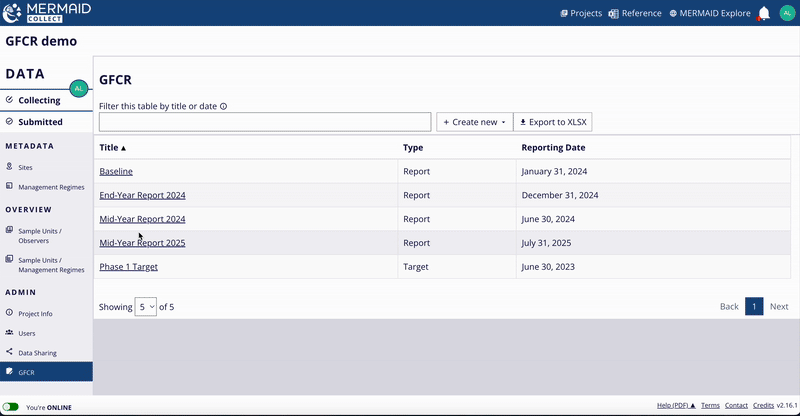
Entering data for Fund Indicators F1-F7
F1 Programme area
Click on F1 Programme area on the sidebar and enter the total area of coral reefs (in km²) in the field F 1.1 Total area of coral reefs in GFCR Programme.
Note: Report F 1.1 as cumulative totals across all reporting periods since the start of the GFCR Program. If sub-indicator has no new value for a given report, simply enter the last reported value. |
For example, add the newly included area from the current reporting period to the total reported previously. If 50 km² of coral reef area were recently added to the GFCR Program and 200 km² were reported earlier, you would report a total of 250 km² in the current report.
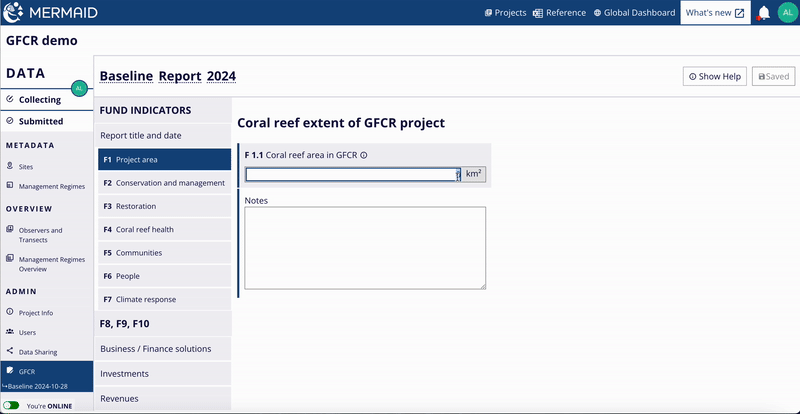
To obtain the reef area, we suggest using Allen Coral Atlas:
On the Atlas, enable the Reef Extent map layer
Zoom into the area of interest
Use to polygon tool to outline your reef area
Once your polygon has been created, hit enter and a Stats modal will pop out with the reef extent area calculated in km².
When logged in, you can name and save your polygon, as well as download data. Ensure to check the Reef extent box before downloading.
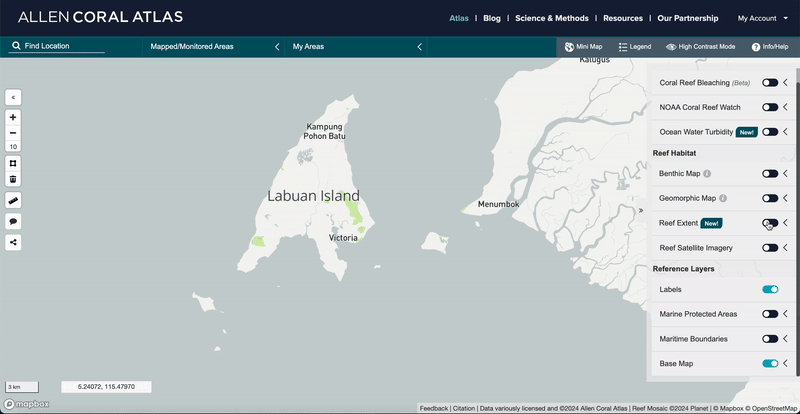
F2 Conservation and management
Click on F2 Conservation and management on the sidebar, then input the area sizes (in km²) for F 2.1 to F 2.5. Ensure you enter the correct areas, as there are distinctions between coral reef areas and total areas.
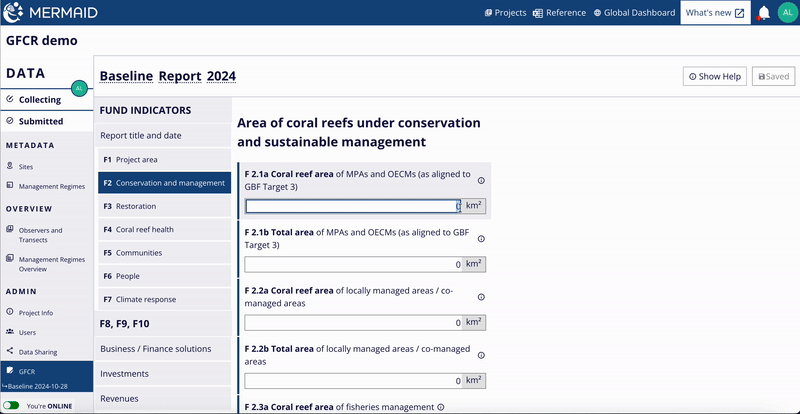
To obtain the reef areas and total areas (in km²), you can use Allen Coral Atlas by following the steps on F1 Programme area.
In addition, there are other global platforms and databases to extract data for Marine Protected Areas (MPAs), Other Effective area-based Conservation Measures (OECMs), and Locally-Managed Marine Protected Areas (LMMAs) (e.g., Protected Planet, Marine Protection Atlas, Resources Watch). You can also refer to regional and local databases.
Note: report F 2.1 to F 2.5 as cumulative totals across all reporting periods since the start of the GFCR Program. If sub-indicators have no new values for a given report, simply enter the last reported values. |
F3 Restoration
Click on F3 Restoration on the sidebar, then input the values and area size (in km²) for F 3.1 to F 3.6.
For F 3.1 Area of effective coral reef restoration, to obtain the area of effective coral reef restoration (in km²), you can use Allen Coral Atlas by following the steps on F1 Programme area. This indicator is a subset of F1 and used to measure only the area of coral restoration activities in a GFCR Programme.
For F 3.5, the number of people engaged in coral reef restoration is disaggregated by gender (i.e., men and women), youth (between the ages of 15 and 24 as defined by the United Nations) and Indigenous peoples.
Even if your GFCR Program does not engage in any restoration activities, you are still required to report this indicator. The default values are set to '0', and you can leave them as they are if no restoration activities are being conducted.
Note: Report F 3.1 to F 3.6 as cumulative totals across all reporting periods since the start of the GFCR Program. If sub-indicators have no new values for a given report, simply enter the last reported values. |
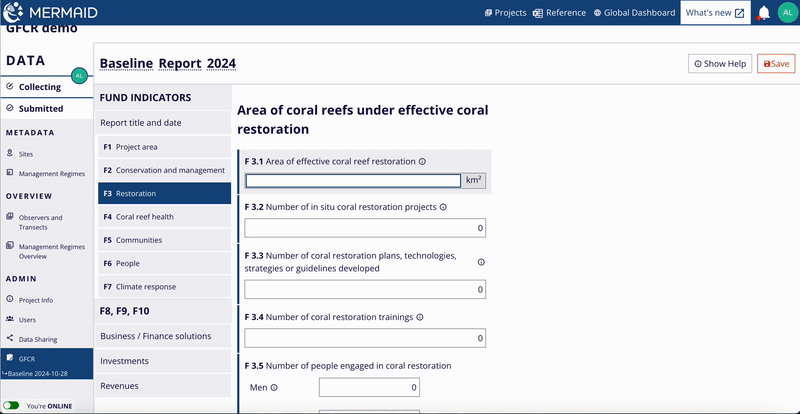
F4 Coral reef health
MERMAID will automatically add your coral reef health indicators from the ecological data you entered in the same project.
Click on F4 Coral reef health on the sidebar, then input the values for coral reef health indicators F 4.1 to F 4.3.
If you have submitted ecological coral reef data for all your GFCR-associated sites inside this GFCR project, you can use the automated calculation tool for reef health indicators:
Select the start and end date for the Reporting date range. The start date should correspond to the date of the initial reef surveys (baseline), and the end date should be the date of the most recent reef surveys conducted within the reporting period.
Average live hard coral cover, average macroalgae cover, and average reef fish biomass are automatically calculated based on all submitted surveys within that reporting period, aggregated across all sites.
Fields F 4.1, F 4.2 and F 4.3 are automatically populated with averages. This way you do not need to calculate any value manually.
Another option is to manually input each sub-indicator if your surveys are in other projects on MERMAID or stored in a different database.
Note: Report F 4.1 to F 4.3 as averages across all your sites based on the most recent surveys. If there are no new surveys available for this reporting period then enter previously reported averages. |
If your GFCR Program has ecological data submitted in multiple MERMAID projects, the automated tool for calculating F4 sub-indicators will not be able to access data from projects outside the one currently selected. However, you can use the MERMAID R package to access and aggregate data across projects, provided you have authenticated access. This approach enables you to calculate average values for all F4 sub-indicators for the reporting period across your GFCR Program sites with ecological data stored in different MERMAID projects. For detailed guidance, read more in Using MERMAID R Package.
Alternatively, you may export an individual XLSX file from each project in MERMAID Collect and manually calculate the averages for the reporting date range in any analysis applications.
Where feasible, include the data in the XLSX file used to calculate these reef health indicators as an appendix to your narrative annual reports if they are not accessible in your GFCR project in MERMAID Collect. In the Notes field, add details about how these averages were calculated and how they will be submitted as raw data to the GFCR.
If you want to learn more about submitting ecological data in your GFCR project in MERMAID, please read the sections under Using MERMAID Collect.
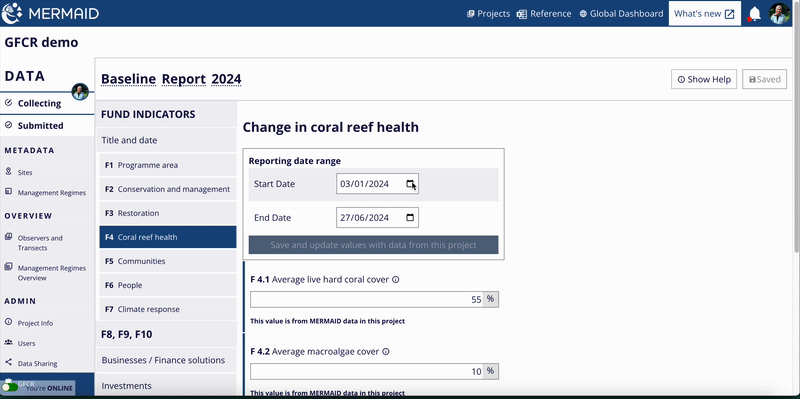
F5 Communities
Click on F5 Communities on the sidebar, then input the values for sub-indicators F 5.1 to F 5.6.
For F 5.4, the number of local practicioners is disaggregated by gender (i.e., men and women), youth (between the ages of 15 and 24 as defined by the United Nations) and Indigenous peoples.
For F 5.6, you should only report the number of national policies linked to GFCR engagement that have been finalized by the time of reporting. If Programs are not planning national policy targets, or if a policy is underway but not yet finalized should enter '0'.
Note: Report F 5.1 to F 5.6 as cumulative totals across all reporting periods since the start of the GFCR Program. If sub-indicators have no new values for a given report, simply enter the last reported values. |
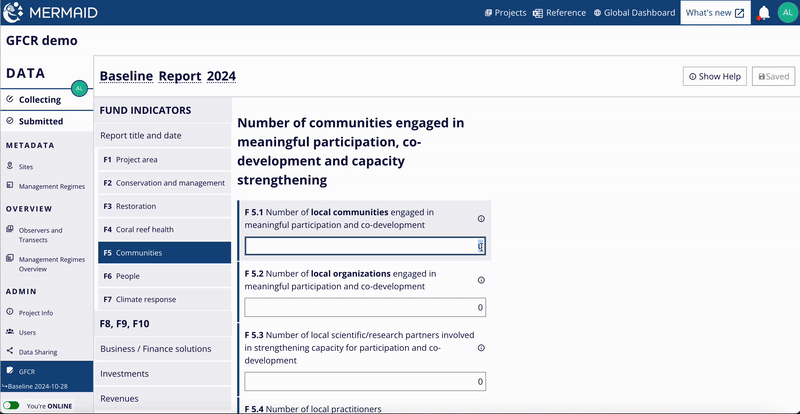
F6 People
Click on F6 People on the sidebar, then input the values for sub-indicators F 6.1.
For F 6.1, the number of direct jobs created is disaggregated by gender (i.e., men and women), youth (between the ages of 15 and 24 as defined by the United Nations) and Indigenous peoples.
Note: Report F 6.1 as cumulative totals across all reporting periods since the start of the GFCR Program. If sub-indicators have no new values for a given report, simply enter the last reported values. |
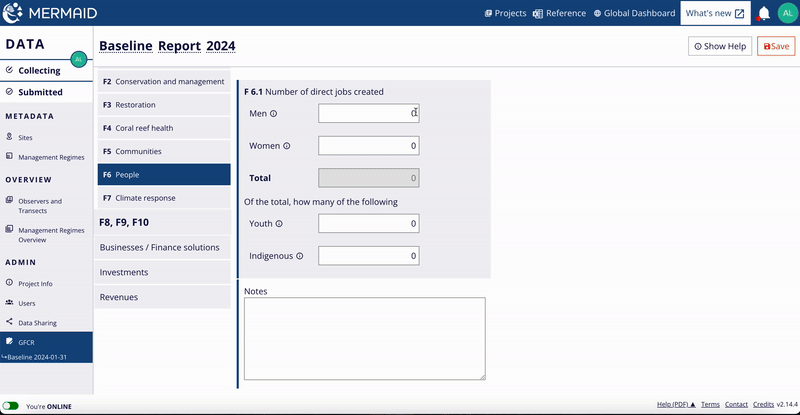
F7 Climate Response
Click on F7 Climate Response on the sidebar, then input the values for sub-indicators F 7.1 to F 7.4.
Note: Report F 7.1 to F 7.4 as cumulative totals across all reporting periods since the start of the GFCR Program. If sub-indicators have no new values for a given report, simply enter the last reported values. |
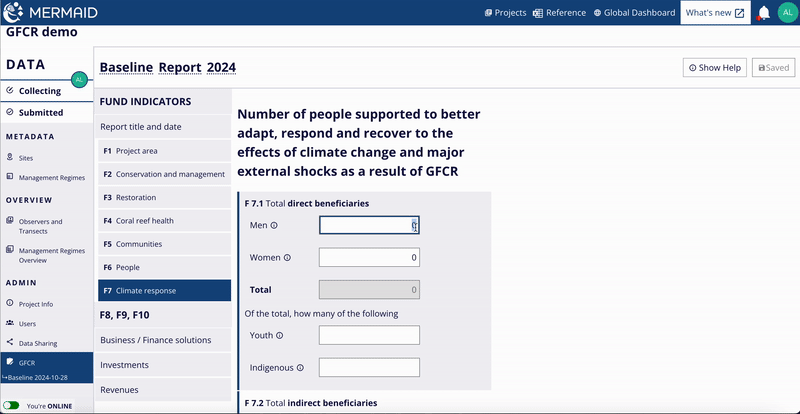
Entering data for Fund Indicators F8-F10
Businesses / Finance solutions
Each reef-positive business, sustainable finance mechanism or finance facility in your GFCR Program should be entered separately and disaggregated by sector.
For each solution:
Go to + Add Business / Finance Solution to add a new business, finance mechanism or finance facility.
Important: For Fund Indicators F8, F9, F10, data is disaggregated by three types of solutions: reef-positive business, sustainable finance mechanism and finance facility (i.e., conservation trust fund, incubator/accelerator, technical assistance facility, and revolving finance facility).
Enter name of solution in the Business / Finance solution name field.
Select sector type for solution from dropdown options in the Sector field.
Here the revised list of sectors for solutions:
Sectors
Sustainable Ocean Production
Fisheries / Aquaculture / Mariculture / Sustainable Small-Scale Fisheries / Marine Biotechnology Products / Other
Sustainable Coastal Development
Ecotourism / Coastal Infrastructure / Coral Restoration Revenue Models / Other
Circular Economy and Pollution Management
Sustainable Infrastructure / Waste Management / Pollution Mitigation / Other
Financial Mechanisms
Blue Carbon Credits / Biodiversity Credits / Resilience Credits / Insurance Mechanisms / Conservation Trust Fund / MPA User Fee / Other
For reef-positive businesses, select one relevant sector from the following categories: Sustainable Ocean Production, Sustainable Coastal Development, Circular Economy, or Pollution Management. Do not select any sector listed under Financial Mechanisms.
For finance mechanisms, choose an appropriate option from the Financial Mechanisms category.
For finance facilities, select Financial Mechanisms – Other, or Financial Mechanisms-Conservation Trust Fund.
In the Used an incubator? field, choose Yes: GFCR-funded, Yes: non-GFCR-funded or No to indicate whether an incubator was used for development and identify its funding source.
If your solution utilized an incubator before the start of the GFCR Program, you should select 'No' for this field—unless the solution is also using a GFCR-funded incubator during the Program period.
Choose Yes or No to indicate whether the solution is a local enterprise in the Local enterprise field.
Choose Yes or No to indicate whether the solution uses the Gender 2x Criteria in the Gender 2x Criteria field.
Each solution should be well-acquainted with the Gender 2X Challenge and its Criteria. An assessment can be conducted to determine whether the solution meet these Criteria thresholds here.
While GFCR does not mandate a 2X Certification, it expects solutions to strive toward meeting these standards and to evaluate their alignment with the 2X criteria.
When adding a reef-positive business, do not select any option in the Sustainable finance mechanisms field.
For a finance mechanism, select the mechanism that is applicable from the available options.
For a finance facility, choose the appropriate type—Conservation Trust Fund, Incubator / Technical Assistance Facility, or Revolving Finance Facility—in the Sustainable finance mechanisms field.
Identifying the cycle stage (e.g., launch, growth, maturity) of each solution is important and can be documented in the Notes field for each entry, as well as in the annual narrative report. This would give more context for determining its success against investments and revenues.
You will have access to a list of all the solutions added on the Businesses / Finance Solutions page. You can make changes to this list at any time.
As new solutions are added to the Program, include them in your subsequent reports.
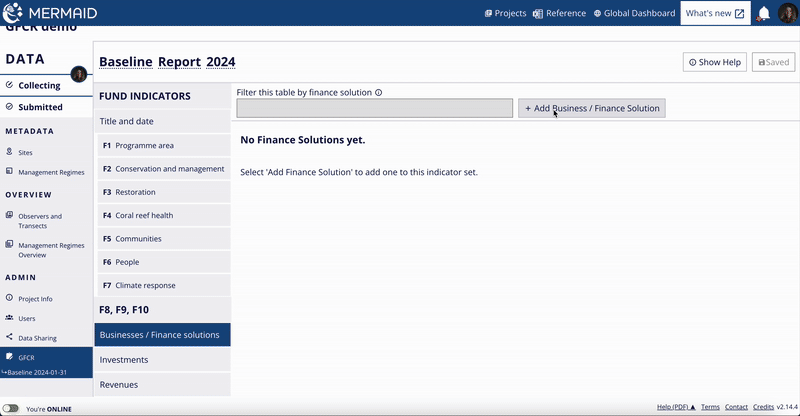
Investments
The GFCR Program categorize investments into three distinct stages: anticipated, committed, and secured.
Secured – investment funds transferred and are with the Convening Agents.
Committed – contract or agreement signed but funds have not yet been transferred. There is a formal obligation to provide funding for a certain period, but the funds have not been deployed yet.
Anticipated – funding expected or planned to occur in the future and discussions are underway, but no formal agreement has been signed.
Convening agents should report only secured or committed funds in Collect as data for Fund Indicators F 8.1, F 8.2, F 8.3 or F 9.1 – meaning that there is a signed agreement or the funds have already been received. Anticipated funds can be reported in the annual narrative reports.
Important: You will enter both committed and secured investments for each solution from your GFCR Programme separately and disaggregated by investment source (i.e., GFCR, philanthropy, private, public) and type. Do not report investments for finance facilities (i.e., conservation trust funds, incubator/technical assistance facility, or revolving finance facility) unless they were exclusively used by the facility itself, and not by the reef-positive businesses or finance mechanisms it supports. |
For each solution, except for finance facilities:
Go to + Add investment to add a new investment for a solution.
In Business / Finance solution name, choose the solution from the list of solutions previously created. Remember, you will report investments for each solution.
Choose the source from the dropdown options (i.e., GFCR, Philanthropy, Private and Public) in the Investment source field.
If a solution receives investment from multiple sources (e.g., both GFCR and private), you will need to enter each investment separately for this solution (e.g., once for the GFCR investment and once for the private investment).
Choose the type from the dropdown options in the Investment type field.
If a solution receives multiple types of investment from a single source (e.g., a grant and technical assistance from GFCR), you will need to enter each type separately under that specific investment source for the solution—for example, once for the grant and once for the technical assistance from GFCR.
Enter the accumulated investment amount in the Investment amount field.
Note: Report committed or secured investments as cumulative totals across all reporting periods since the start of the GFCR Program. If there are no new investments for a given report, simply enter the last reported investment amounts. |
If available, please add cumulative anticipated investment amounts to the Notes section and ensure they are included in your annual narrative reports.
You will have access to all the investments listed on the Investments page. You can modify these entries at any time.
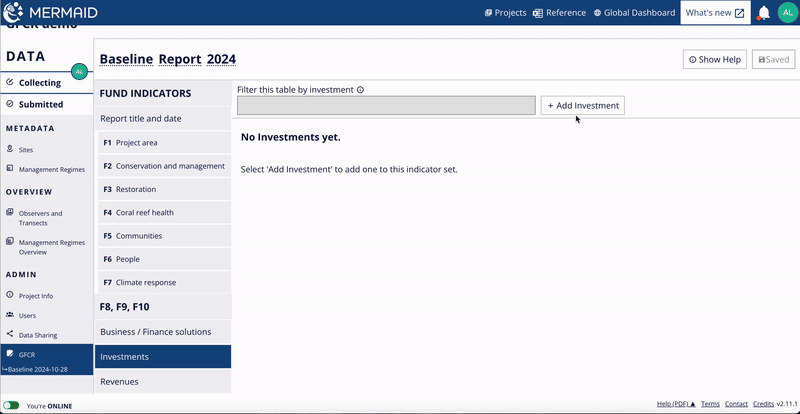
Revenues
Important: For your GFCR Program, you will enter the revenues for each solution separately, disaggregated by revenue type. Revenues for individual solutions should be reported independently and only once to prevent double counting. |
Do not enter revenues for finance facilities, such as conservation trust funds, incubator / technical assistance facility, or revolving finance facility.
For each solution, except for finance facilities:
Go to + Add revenue to add a new revenue stream for a solution.
In Business / Finance solution name, choose the solution from the list of solutions previously created. Remember, you will report revenues for each solution.
Choose the type from the dropdown options in the Revenue type field.
If a solution receives revenues from multiple streams (e.g., both biodiversity offsets and blue bonds), you will need to enter each revenue stream separately for this solution (e.g., once for the biodiversity offsets and once for blue bonds).
Choose Yes or No to indicate whether the revenue is sustainable in the Sustainable revenue stream field.
Enter the accumulated revenue amount for the reporting period in the Revenue amount field.
Note: Report revenues as cumulative totals across all reporting periods since the start of the GFCR Program. If there are no new revenues for a given report, simply enter the last reported revenue amounts. Do not report revenues for finance facilities (i.e., conservation trust funds, incubator/technical assistance facility, or revolving finance facility) unless they were exclusively generated by the facility itself, and not by the reef-positive businesses or finance mechanisms it supports. |
You will have access to all the revenues listed on the Revenues page. You can modify these entries at any time.
If your GFCR Program has a GFCR-funded finance facility, it is highly recommended to track and report on solutions even after they exit your GFCR-funded finance facility. Doing so helps demonstrate the long-term impact and return on investment beyond the initial funding period. By monitoring post-incubation success, you can attract further investment opportunities and showcase the added value of the solutions, which is crucial for sustaining growth and scaling beyond 2030.
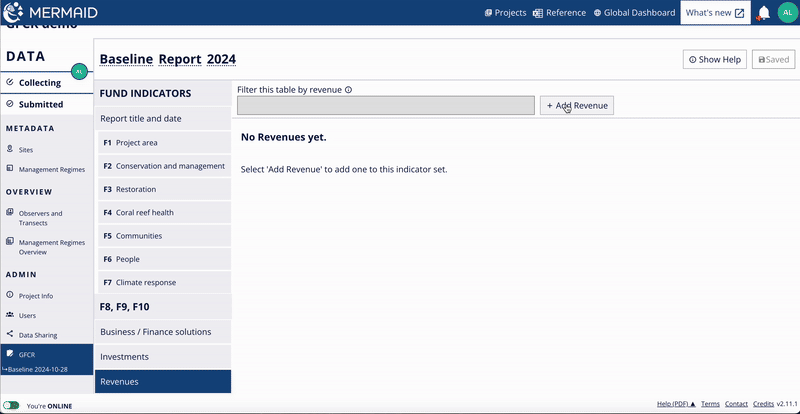
Exporting and visualizing GFCR data
Export your GFCR data
After creating your targets, baselines, and progress reports, you can export all your reports from the main GFCR page. Simply click on Export to obtain an XLSX file containing all your reports. In the XLSX file, each tab corresponds to a specific Fund Indicator.
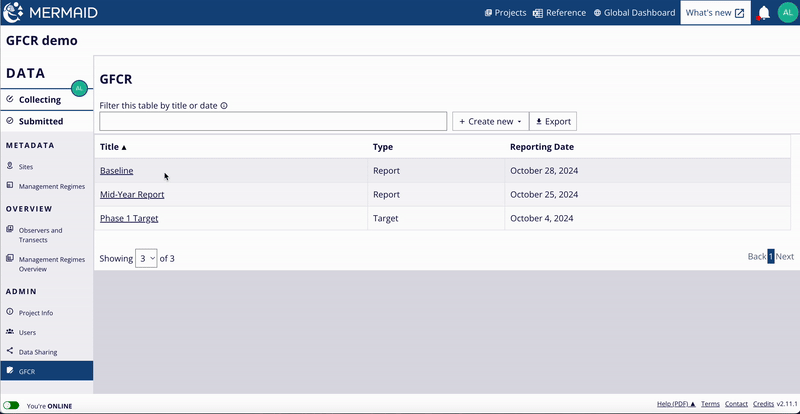
View GFCR projects in MERMAID Explore
To view all projects tagged with Global Fund for Coral Reefs:
Go to the MERMAID Explore
Select the Filter icon on the left-hand toolbar
Filter organizations to Global Fund for Coral Reefs in the Organizations field
Check the map view and summary metrics on the right panel for coral reef ecological data from GFCR projects
For a tabular summary of all GFCR projects:
Click the Table View button (looks like a table icon) at the top left of the map.
The table displays summary information (Project Name, Dates, Countries, Organizations, Survey/Transect counts) for all the GFCR projects.
To export this summary table, click Export CSV at the top of the table.
Switch back anytime using the Map View button (looks like a map icon).
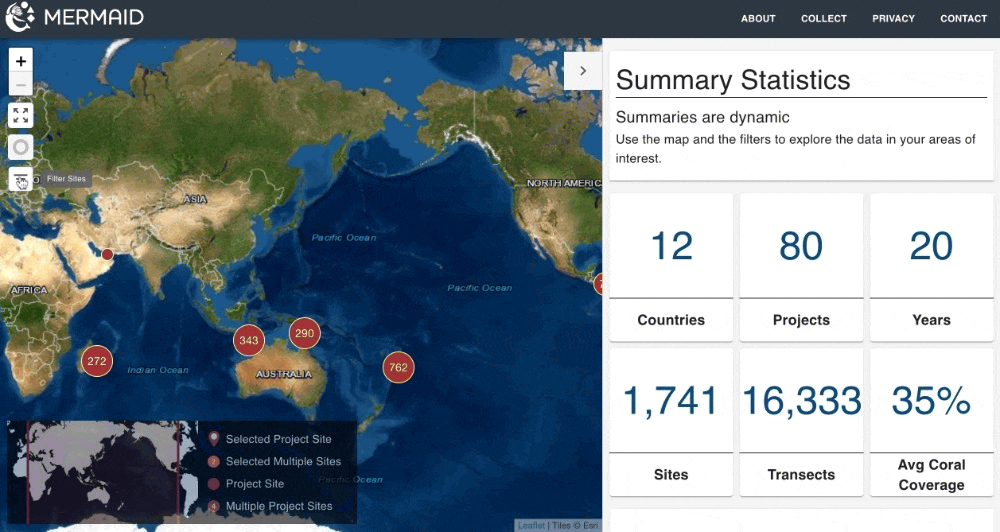
Export GFCR data from MERMAID Explore
To export GFCR Fund Indicator data (Targets/Reports):
Click the Export data and select GFCR data.
A list of relevant GFCR projects appears.
Click Send Email with link to receive the Fund Indicator data export.
To export GFCR project reef health data:
Use the left filter panel and type Global Fund for Coral Reefs or GFCR under Organizations.
The map view and summary metrics will update to show only GFCR projects.
Follow the standard data export process described in Export Data (click Export data, select methods, etc.) to export the coral reef ecological data for GFCR projects based on their data sharing policies.