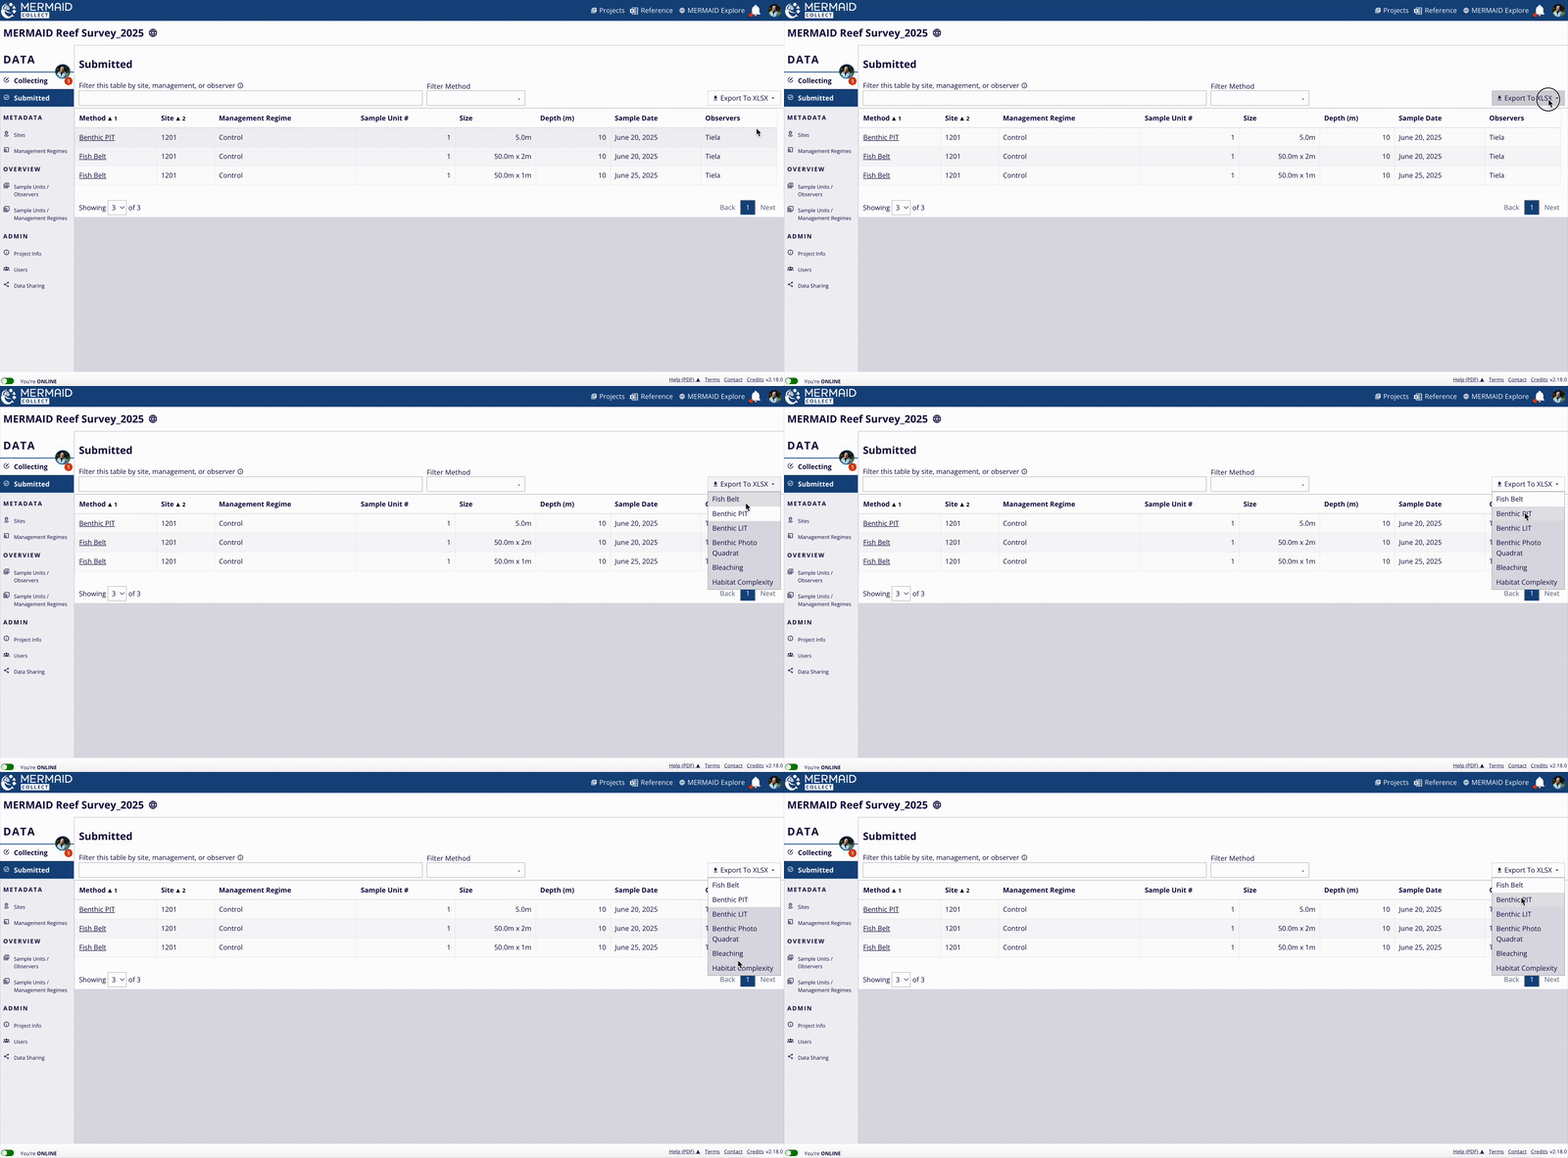
MERMAID makes it easy to export submitted data for further analysis or reporting. All users—whether Admin, Collector, or Read-Only—can export data from a project.
Exporting data from a project
You can export submitted sample units in tabular XLSX format directly from the Submitted page in your project.
Note: You must be online to export data, and only submitted sample units can be exported. |
How to export data:
Go to the Submitted page in your project.
Click the Export to XLSX button and select the method you want to export data for.
Only methods with submitted sample units will be selectable. Greyed-out options mean no data has been submitted for that method.

You’ll get a confirmation message Export Successful. A download link will be sent to your MERMAID account email.

Click the link in your email message to download the XLSX file.
All submitted sample units using a selected method will be combined into one spreadsheet.
If your project is a test project:
You can export data from test projects for trial analysis—but these data:
Will not be included in the metric summaries in MERMAID Explore
Will not appear as charts in MERMAID Explore
To change a test project to an actual project:
Go to the Data sharing page in the project’s sidebar.
Uncheck the checkbox This is a test project at the bottom.
Wait approximately 15 minutes for the data to sync with the server.

Exported data files
MERMAID provides standardized export files in XLXS format, which include all submitted sample units at the observation level (this is your raw data) and calculated metric summaries at the sample unit and sample event levels. These files are designed to support both quick review and in-depth analysis using tools like Excel, R, or other data platforms.
How exported data files are formatted
Each exported XLSX file contains the same set of standardized tabs:
Sheet name | Description |
Metadata | Project-level metadata as defined in the Project Info page, including project name, location, organizations, data sharing settings, and citation. |
Sample event (SE) | Summary statistics (means and standard deviations) across all sample units collected at a site on the same date and depth. |
Sample units (SU) | Summary statistics (sums/means) across all observations within each individual sample unit. |
Observations (Obs) | All individual observations collected at each site/date/depth, per sample unit. |
Charts | (Coming soon) Pre-generated charts for metrics using pivot tables. |
These tabs provide progressively more granular data:
Sample event: Aggregated at site-date-depth level
Sample units: Aggregated within each sample unit
Observations: Raw-level observation data
What metric summaries are included
Exported files include all metric summaries that are automatically calculated within MERMAID—and often more. For each method, MERMAID provides average values and standard deviations per sample event to help you assess variability across your data.
Method | Metric summaries |
Benthic PIT, LIT, and photo quadrat |
|
Fish belt |
|
Bleaching |
|
Habitat complexity |
|
These metrics mirror the summaries you see in MERMAID’s Collect for each sample unit—but also give a more complete, project-level picture in the export file.

Analyzing data with the MERMAID R package
For reproducible workflows, researchers and practitioners can access these same data tables programmatically via the MERMAID R package in R. The package includes tools to:
Retrieve project metadata and raw-level observation data
Access metric summaries at sample event and sample unit levels
Perform automated filtering and analysis
Read more in Using MERMAID R package.