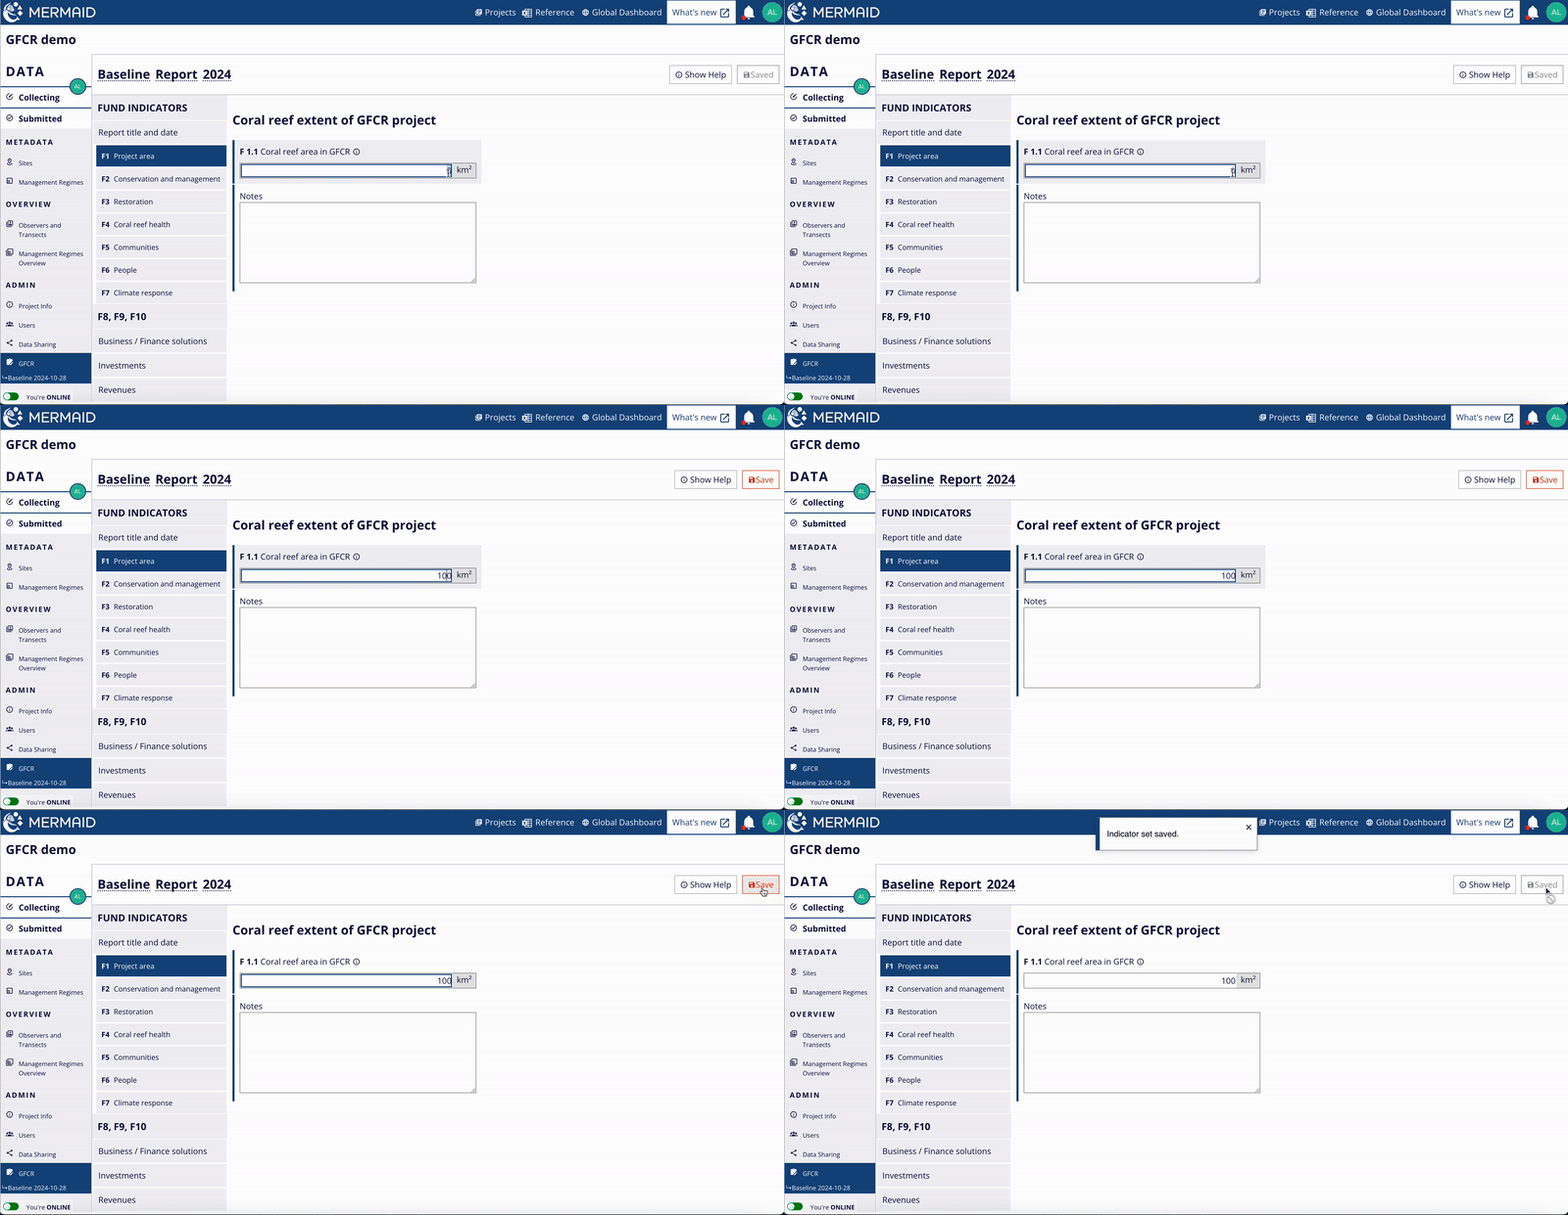
F1 Programme area
Click on F1 Programme area on the sidebar and enter the total area of coral reefs (in km²) in the field F 1.1 Total area of coral reefs in GFCR Programme.
Note: Report F 1.1 as cumulative totals across all reporting periods since the start of the GFCR Program. If sub-indicator has no new value for a given report, simply enter the last reported value. |
For example, add the newly included area from the current reporting period to the total reported previously. If 50 km² of coral reef area were recently added to the GFCR Program and 200 km² were reported earlier, you would report a total of 250 km² in the current report.
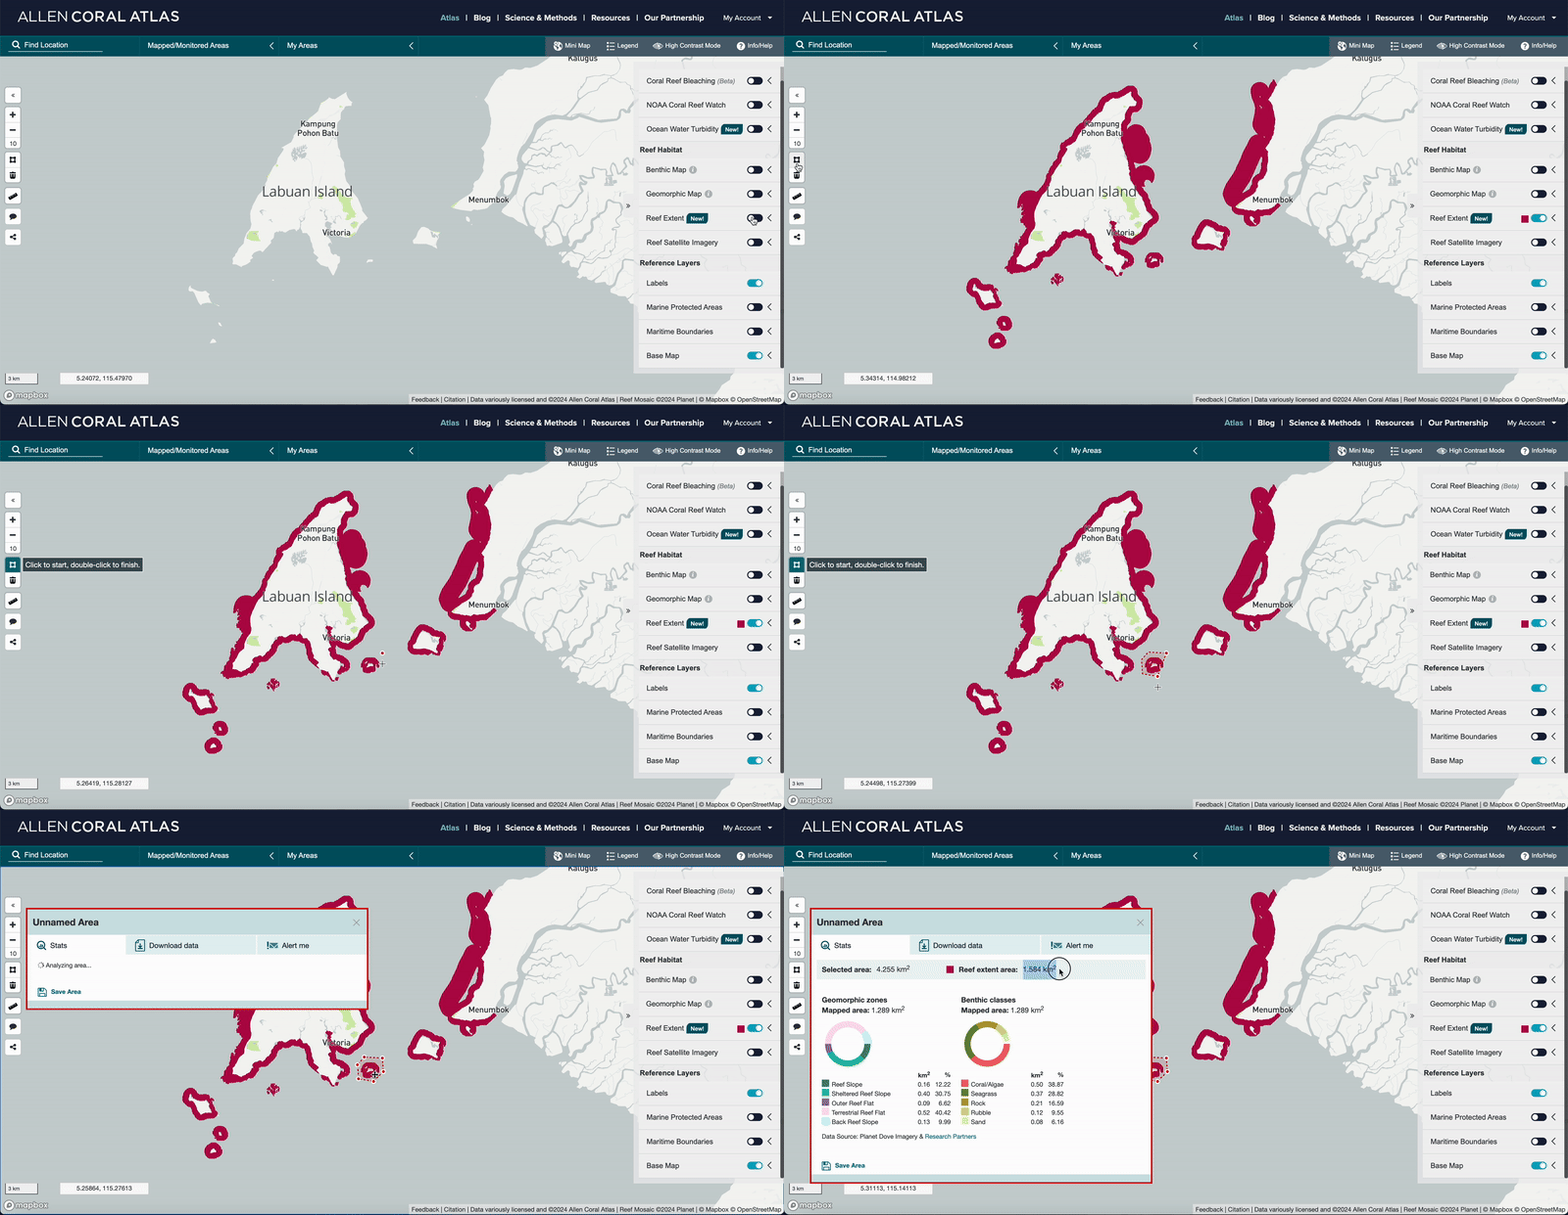
To obtain the reef area, we suggest using Allen Coral Atlas:
On the Atlas, enable the Reef Extent map layer
Zoom into the area of interest
Use to polygon tool to outline your reef area
Once your polygon has been created, hit enter and a Stats modal will pop out with the reef extent area calculated in km².
When logged in, you can name and save your polygon, as well as download data. Ensure to check the Reef extent box before downloading.
F2 Conservation and management
Click on F2 Conservation and management on the sidebar, then input the area sizes (in km²) for F 2.1 to F 2.5. Ensure you enter the correct areas, as there are distinctions between coral reef areas and total areas.
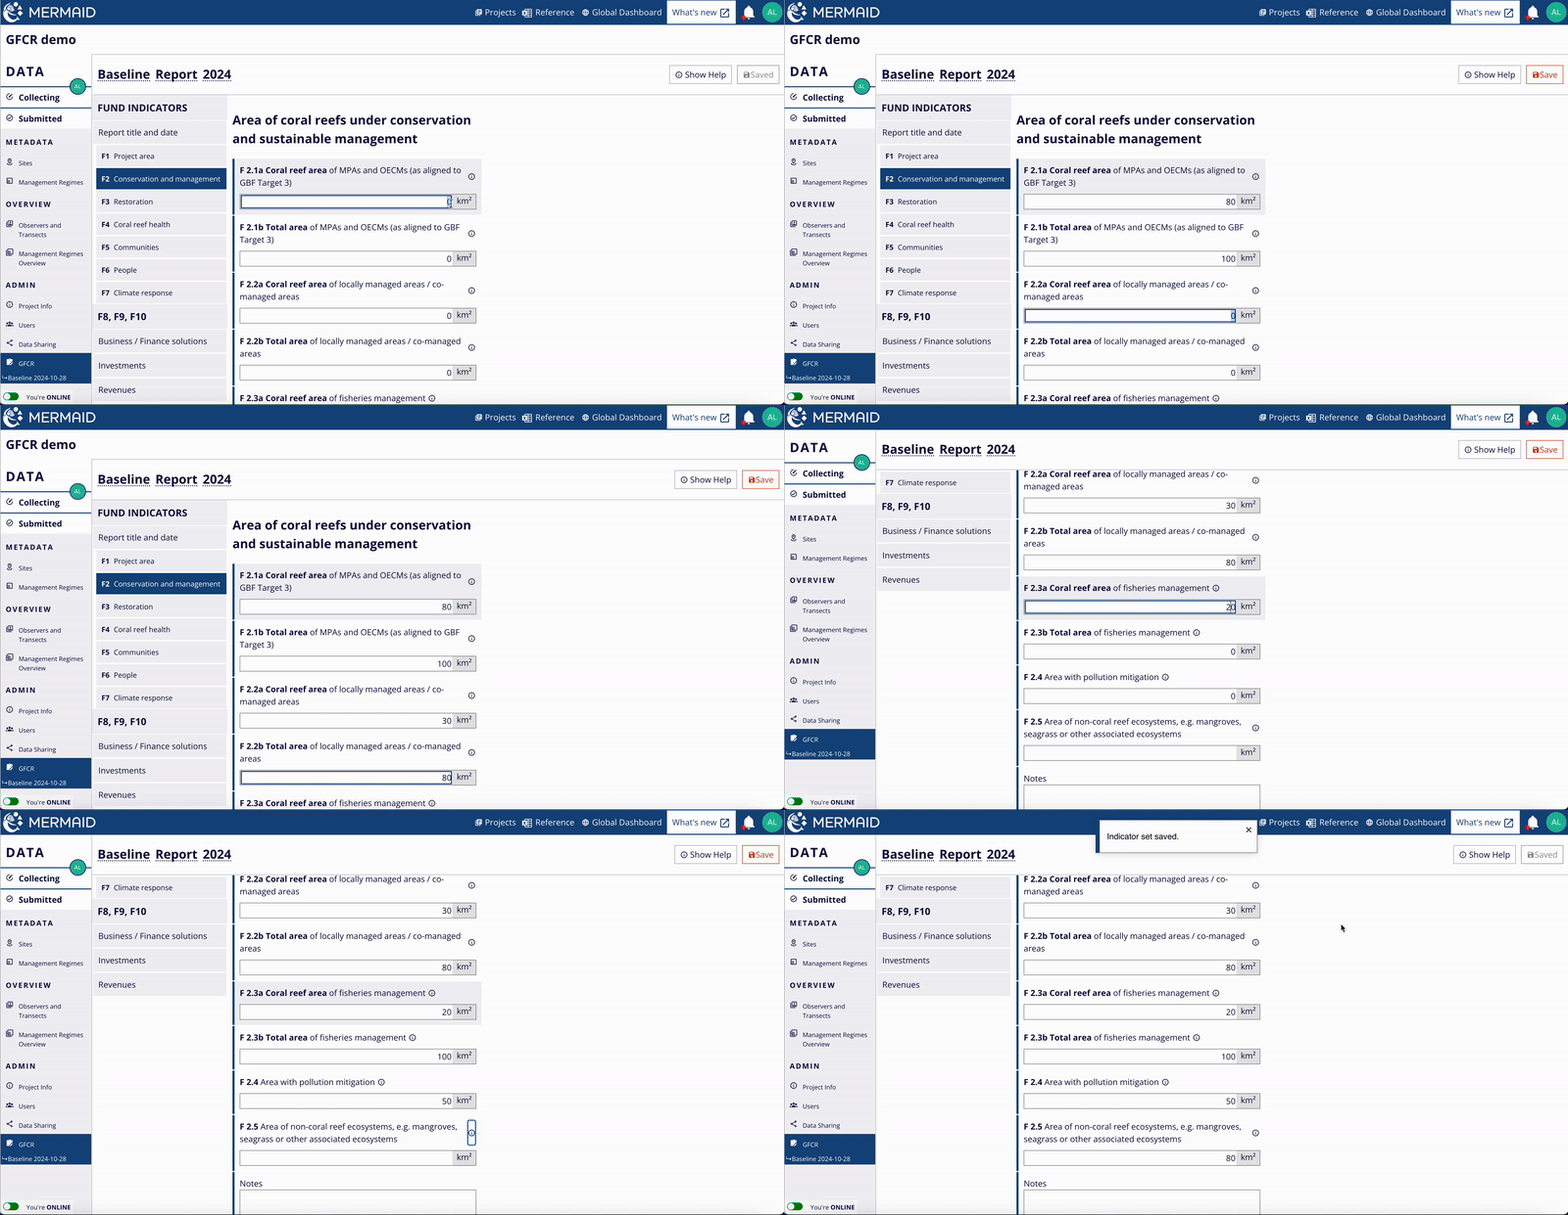
To obtain the reef areas and total areas (in km²), you can use Allen Coral Atlas by following the steps on F1 Programme area.
In addition, there are other global platforms and databases to extract data for Marine Protected Areas (MPAs), Other Effective area-based Conservation Measures (OECMs), and Locally-Managed Marine Protected Areas (LMMAs) (e.g., Protected Planet, Marine Protection Atlas, Resources Watch). You can also refer to regional and local databases.
Note: report F 2.1 to F 2.5 as cumulative totals across all reporting periods since the start of the GFCR Program. If sub-indicators have no new values for a given report, simply enter the last reported values. |
F3 Restoration
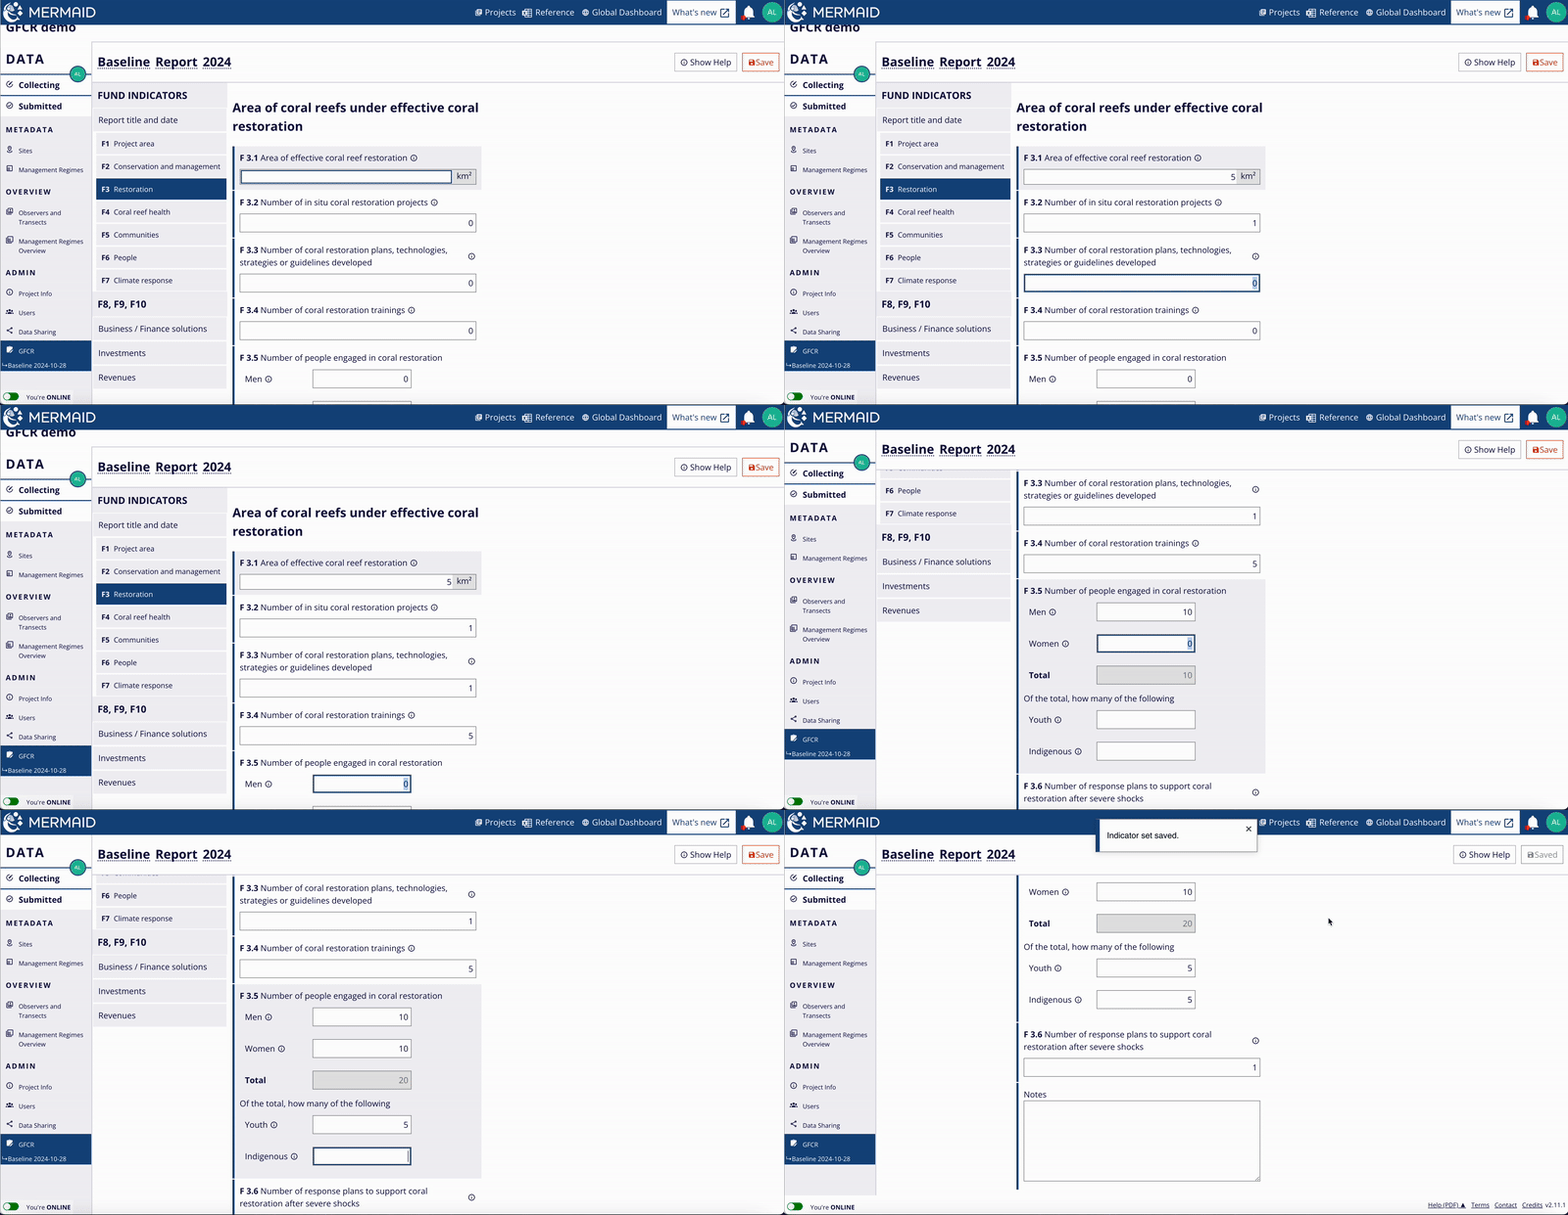
Click on F3 Restoration on the sidebar, then input the values and area size (in km²) for F 3.1 to F 3.6.
For F 3.1 Area of effective coral reef restoration, to obtain the area of effective coral reef restoration (in km²), you can use Allen Coral Atlas by following the steps on F1 Programme area. This indicator is a subset of F1 and used to measure only the area of coral restoration activities in a GFCR Programme.
For F 3.5, the number of people engaged in coral reef restoration is disaggregated by gender (i.e., men and women), youth (between the ages of 15 and 24 as defined by the United Nations) and Indigenous peoples.
Even if your GFCR Program does not engage in any restoration activities, you are still required to report this indicator. The default values are set to '0', and you can leave them as they are if no restoration activities are being conducted.
Note: Report F 3.1 to F 3.6 as cumulative totals across all reporting periods since the start of the GFCR Program. If sub-indicators have no new values for a given report, simply enter the last reported values. |
F4 Coral reef health
MERMAID will automatically add your coral reef health indicators from the ecological data you entered in the same project.
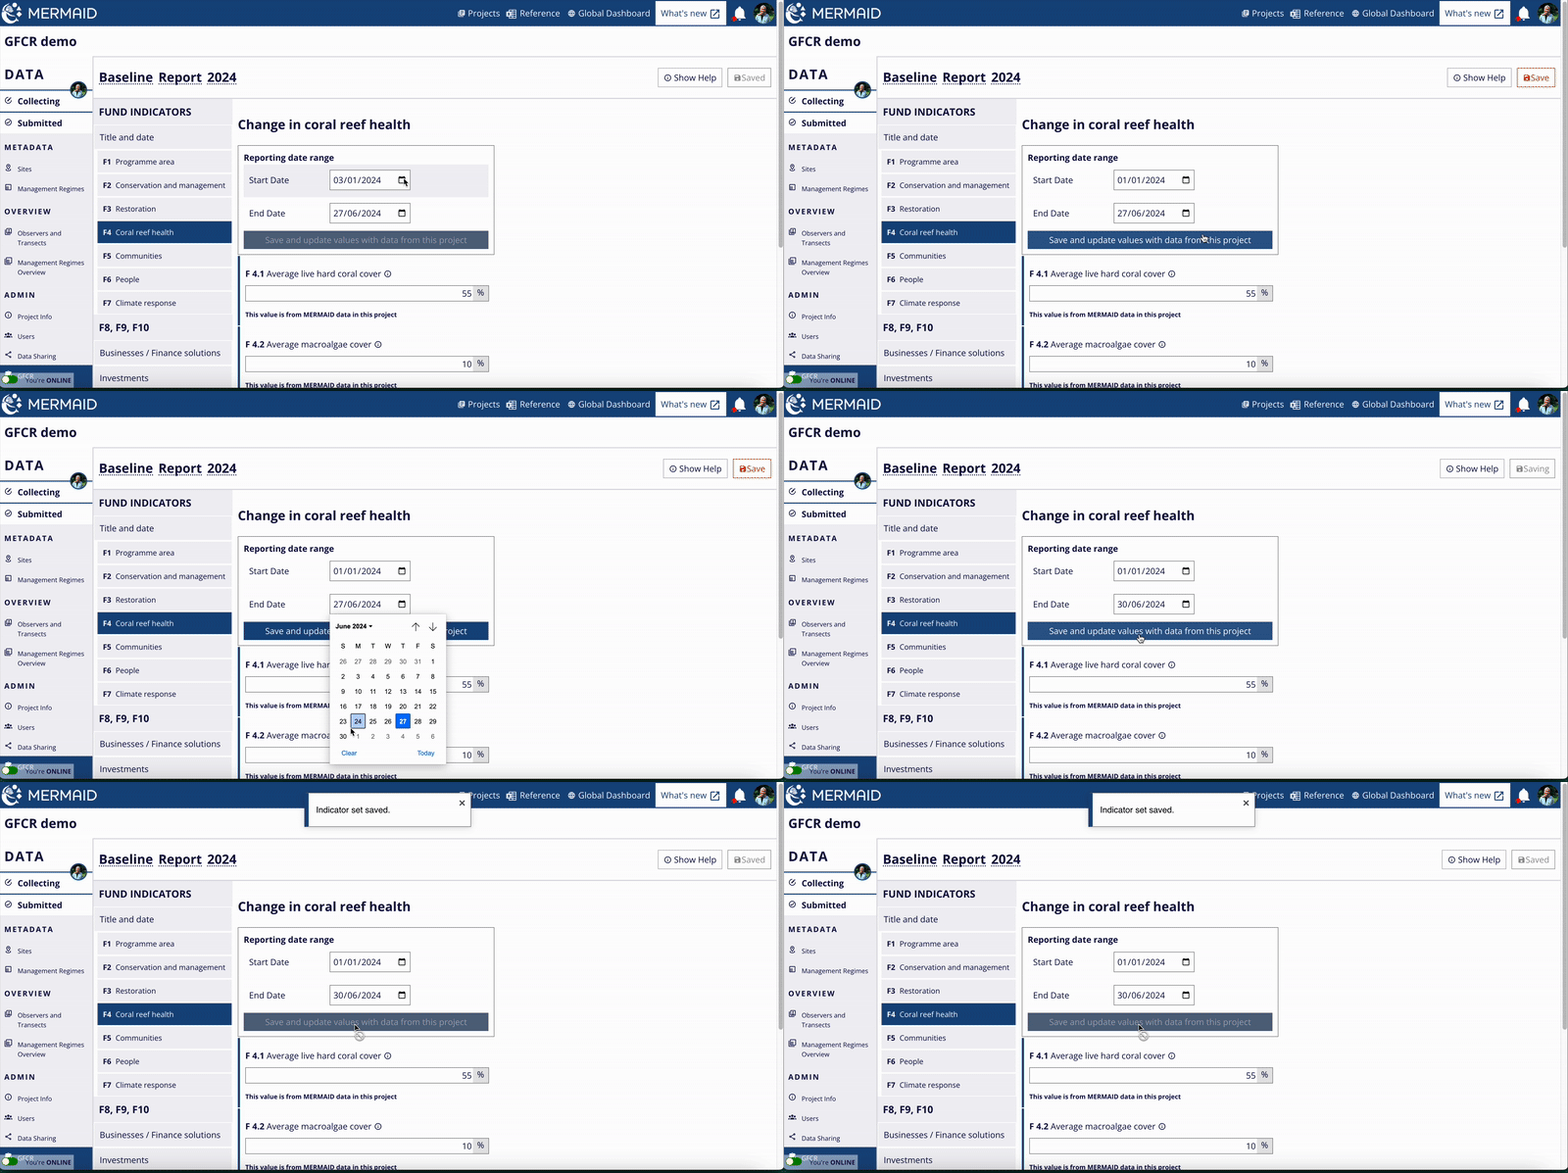
Click on F4 Coral reef health on the sidebar, then input the values for coral reef health indicators F 4.1 to F 4.3.
If you have submitted ecological coral reef data for all your GFCR-associated sites inside this GFCR project, you can use the automated calculation tool for reef health indicators:
Select the start and end date for the Reporting date range. The start date should correspond to the date of the initial reef surveys (baseline), and the end date should be the date of the most recent reef surveys conducted within the reporting period.
Average live hard coral cover, average macroalgae cover, and average reef fish biomass are automatically calculated based on all submitted surveys within that reporting period, aggregated across all sites.
Fields F 4.1, F 4.2 and F 4.3 are automatically populated with averages. This way you do not need to calculate any value manually.
Another option is to manually input each sub-indicator if your surveys are in other projects on MERMAID or stored in a different database.
Note: Report F 4.1 to F 4.3 as averages across all your sites based on the most recent surveys. If there are no new surveys available for this reporting period then enter previously reported averages. |
If your GFCR Program has ecological data submitted in multiple MERMAID projects, the automated tool for calculating F4 sub-indicators will not be able to access data from projects outside the one currently selected. However, you can use the MERMAID R package to access and aggregate data across projects, provided you have authenticated access. This approach enables you to calculate average values for all F4 sub-indicators for the reporting period across your GFCR Program sites with ecological data stored in different MERMAID projects. For detailed guidance, read more in Using MERMAID R Package.
Alternatively, you may export an individual XLSX file from each project in MERMAID Collect and manually calculate the averages for the reporting date range in any analysis applications.
Where feasible, include the data in the XLSX file used to calculate these reef health indicators as an appendix to your narrative annual reports if they are not accessible in your GFCR project in MERMAID Collect. In the Notes field, add details about how these averages were calculated and how they will be submitted as raw data to the GFCR.
If you want to learn more about submitting ecological data in your GFCR project in MERMAID, please read the sections under Using MERMAID Collect.
F5 Communities
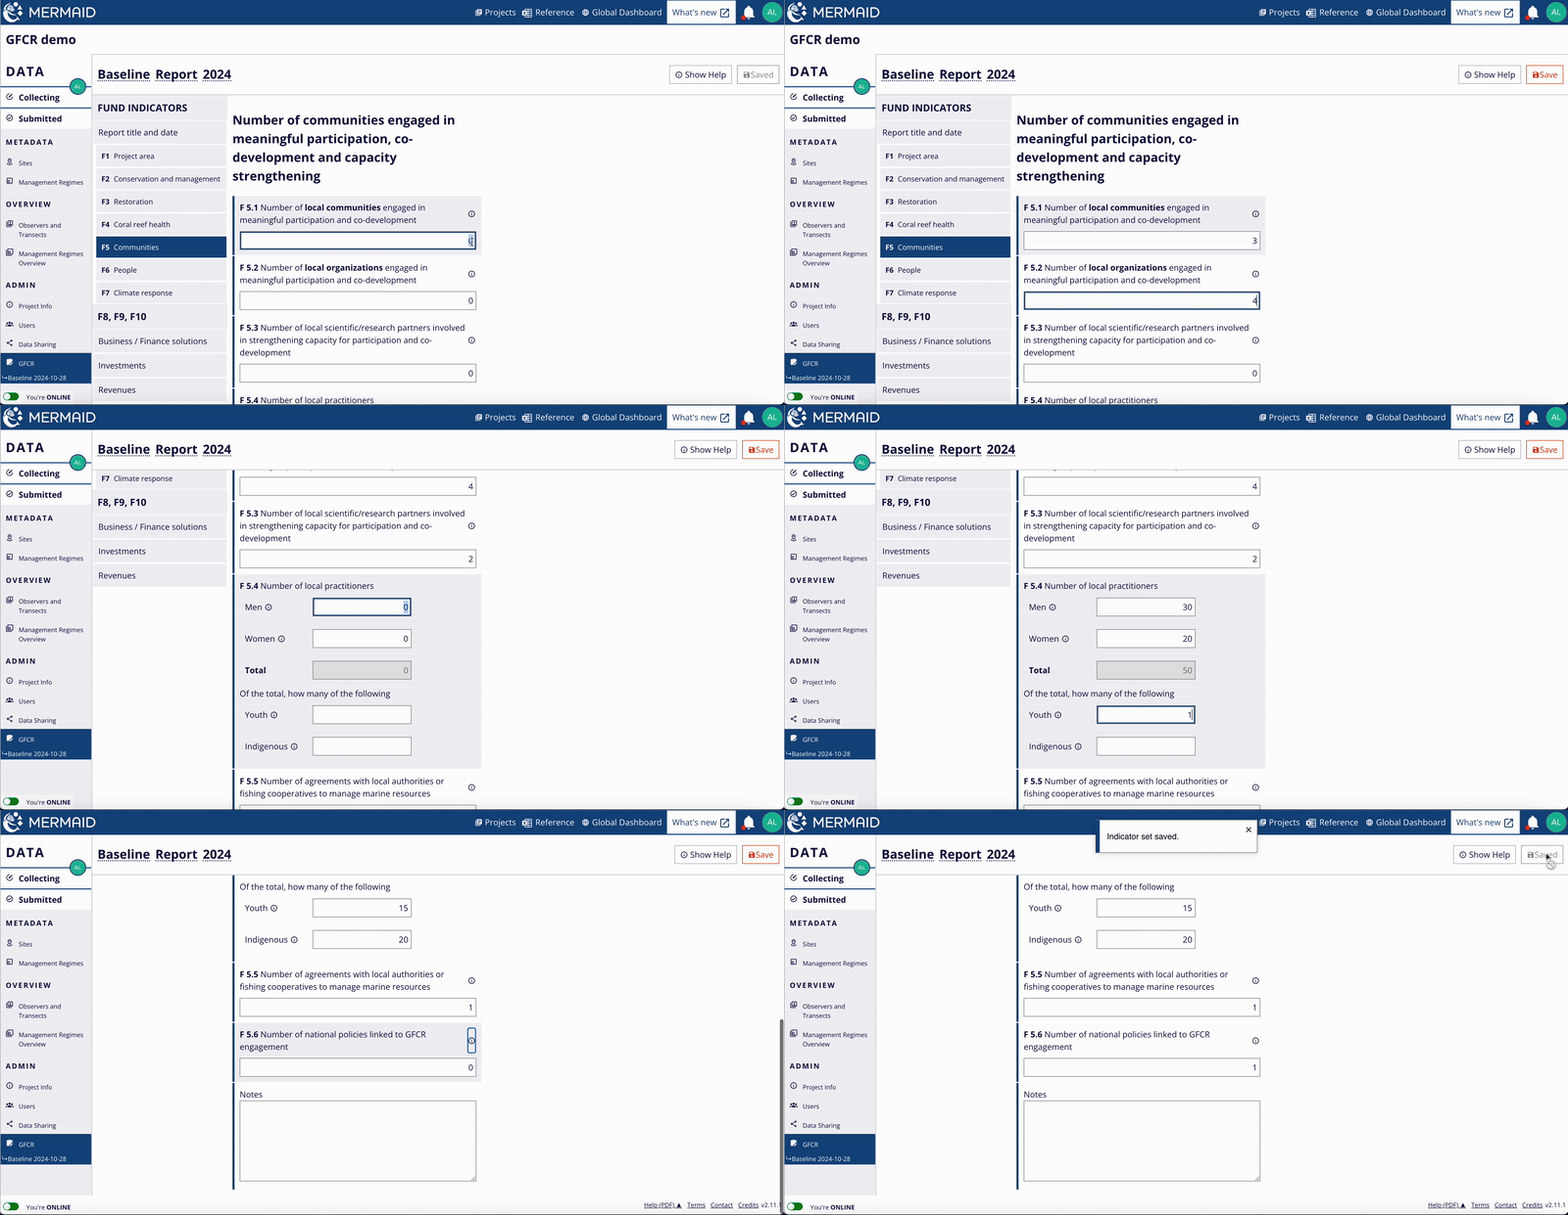
Click on F5 Communities on the sidebar, then input the values for sub-indicators F 5.1 to F 5.6.
For F 5.4, the number of local practicioners is disaggregated by gender (i.e., men and women), youth (between the ages of 15 and 24 as defined by the United Nations) and Indigenous peoples.
For F 5.6, you should only report the number of national policies linked to GFCR engagement that have been finalized by the time of reporting. If Programs are not planning national policy targets, or if a policy is underway but not yet finalized should enter '0'.
Note: Report F 5.1 to F 5.6 as cumulative totals across all reporting periods since the start of the GFCR Program. If sub-indicators have no new values for a given report, simply enter the last reported values. |
F6 People
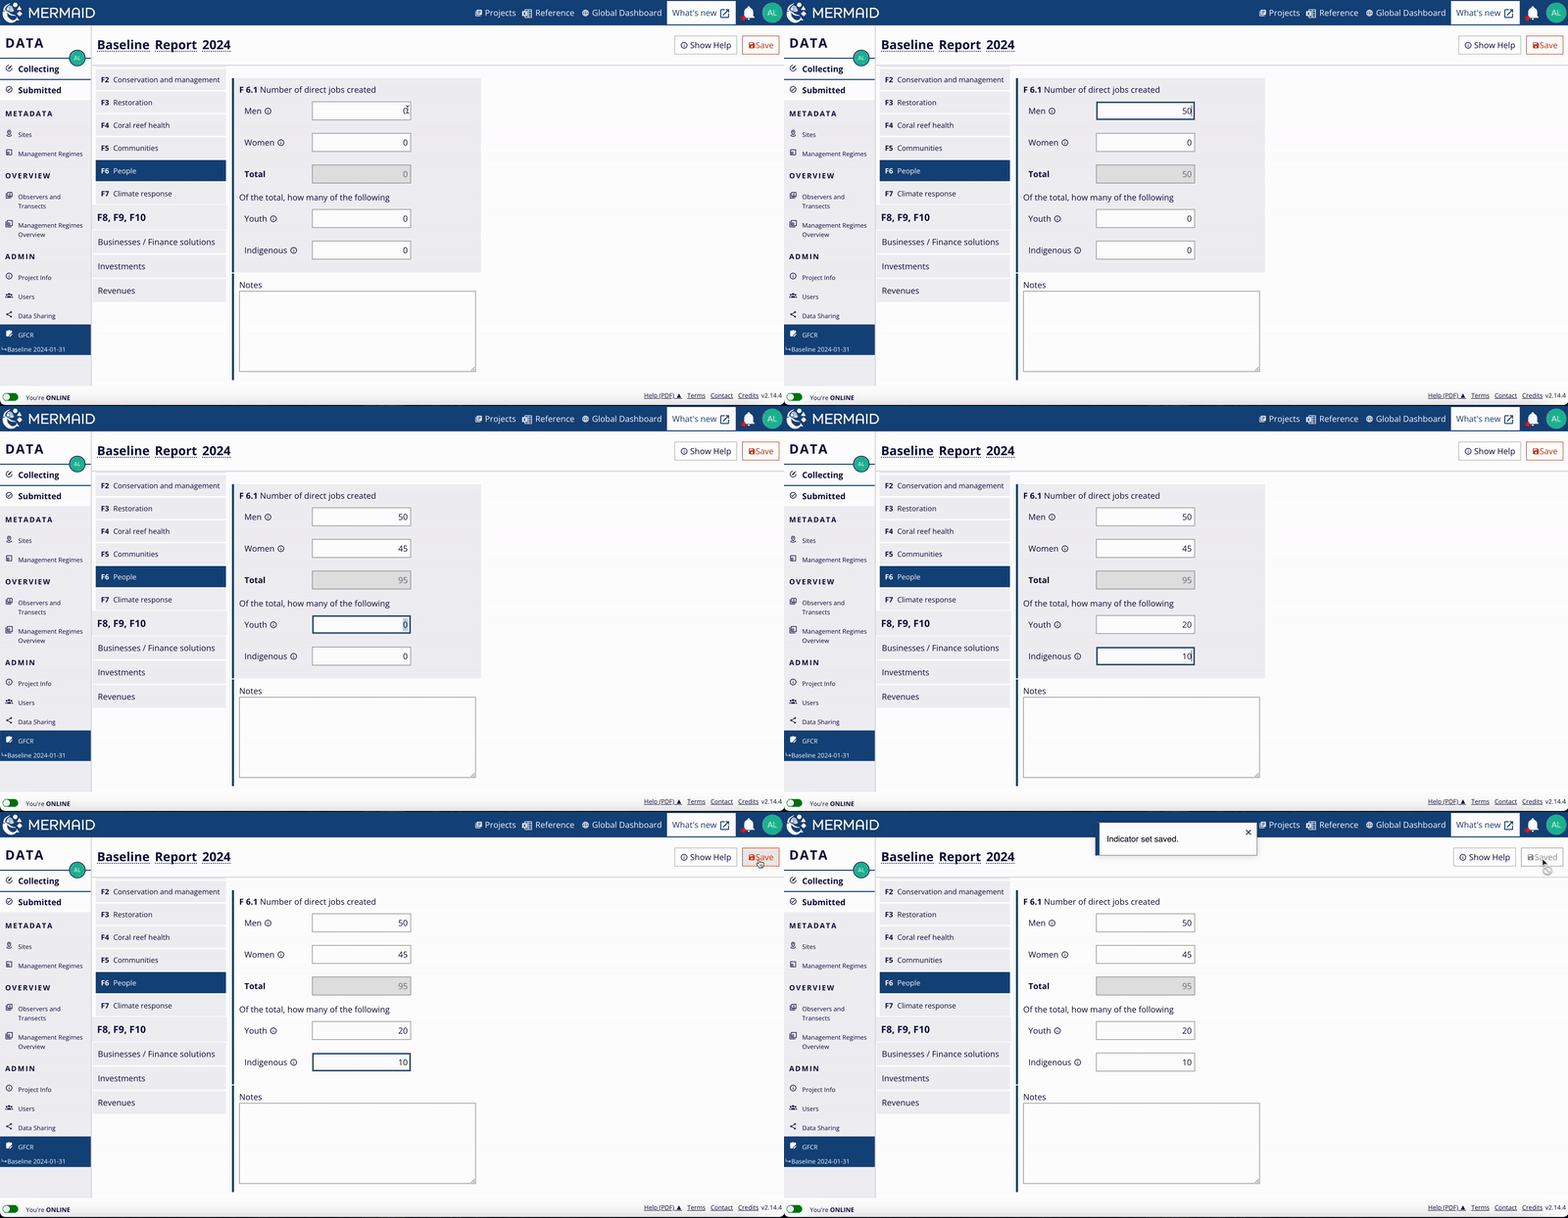
Click on F6 People on the sidebar, then input the values for sub-indicators F 6.1.
For F 6.1, the number of direct jobs created is disaggregated by gender (i.e., men and women), youth (between the ages of 15 and 24 as defined by the United Nations) and Indigenous peoples.
Note: Report F 6.1 as cumulative totals across all reporting periods since the start of the GFCR Program. If sub-indicators have no new values for a given report, simply enter the last reported values. |
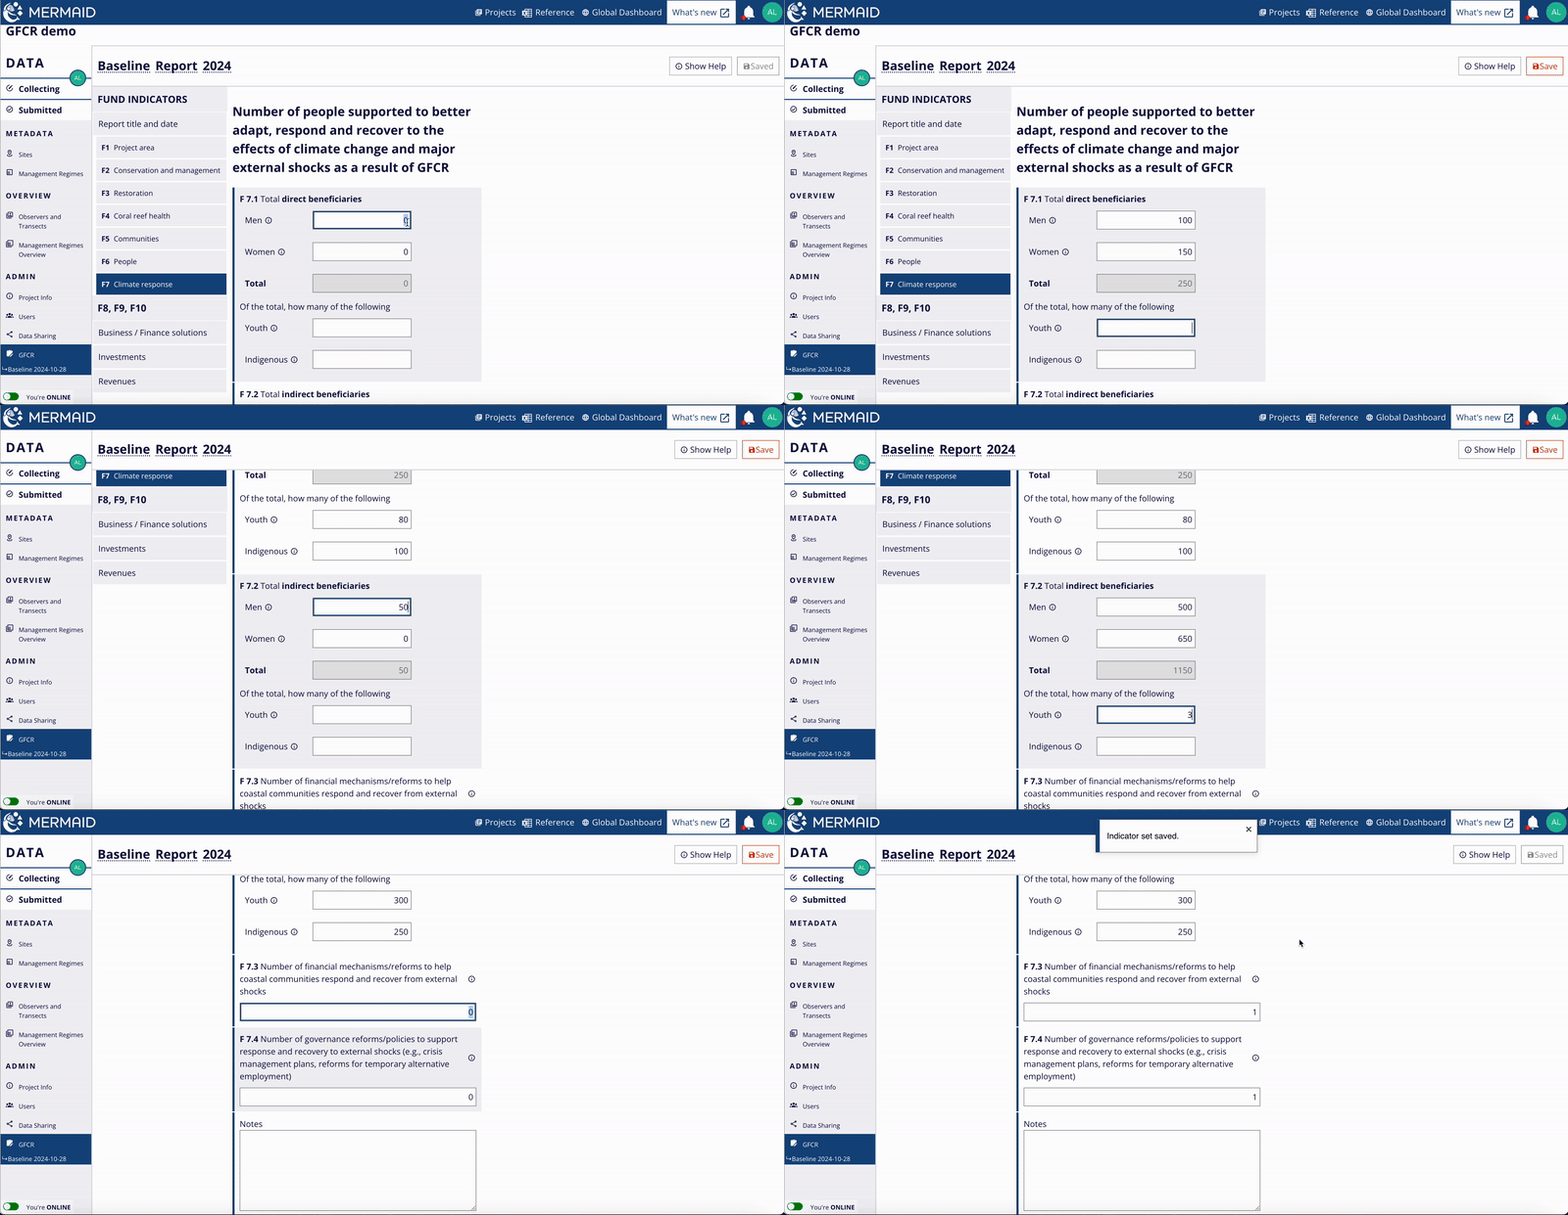
F7 Climate Response
Click on F7 Climate Response on the sidebar, then input the values for sub-indicators F 7.1 to F 7.4.
Note: Report F 7.1 to F 7.4 as cumulative totals across all reporting periods since the start of the GFCR Program. If sub-indicators have no new values for a given report, simply enter the last reported values. |
