MERMAID automatically calculates commonly used reef health metrics that are widely used in coral reef science and management. These metrics summarize your raw field observations into reef fish biomass, percent benthic cover, bleaching severity, and habitat complexity. They are available in MERMAID Collect, MERMAID Explore, as well as in the export XLSX files, and programmatically via the MERMAID R package.
Understanding the MERMAID data hierarchy
All metrics in MERMAID are structured into three levels:
Observation: Individual records (e.g., each fish count for a size class or benthic point). This is your raw data
Sample unit: One transect or survey effort (e.g., one fish belt transect)
Sample event: A site-level aggregation on a given survey date (e.g., all transects in a site on a specific date)

Accessing observations and summary data
Once your data is entered, validated, and submitted in MERMAID Collect, you can export it as a zipped XLSX file. This export file includes separate worksheets for:
Observation data (e.g., individual fish or benthic records)
Sample unit summary (e.g., averages from each transect)
Sample event summary (e.g., site-level averages for a survey date)
You can also access the same data using the mermaid_get_my_projects_data() function in the MERMAID R package mermaidr. Read more in Accessing Project Data.
Fish abundance and biomass
MERMAID calculates both total fish abundance and biomass. Abundance is calculated by summing the count of fish observed for each sample unit. Biomass is calculated using formulas based on FishBase Bayesian length-weight coefficients. MERMAID calculates:
Total biomass (kg/ha) and abundance (individu) for each sample unit
Average biomass (kg/ha) means and standard deviations by:
Sample event
Trophic group (e.g., piscivores, planktivores, herbivores)
Fish family (e.g., Scaridae, Acanthuridae)
Biomass calculation:
MERMAID calculates biomass using the following steps:
Fish biomass (kg/ha) per observation

Total fish biomass (kg/ha) per sample unit by family, and trophic group

Average biomass (kg/ha) per sample event by family, and trophic group. Standard deviations are also included

Benthic cover
MERMAID supports three benthic methods:
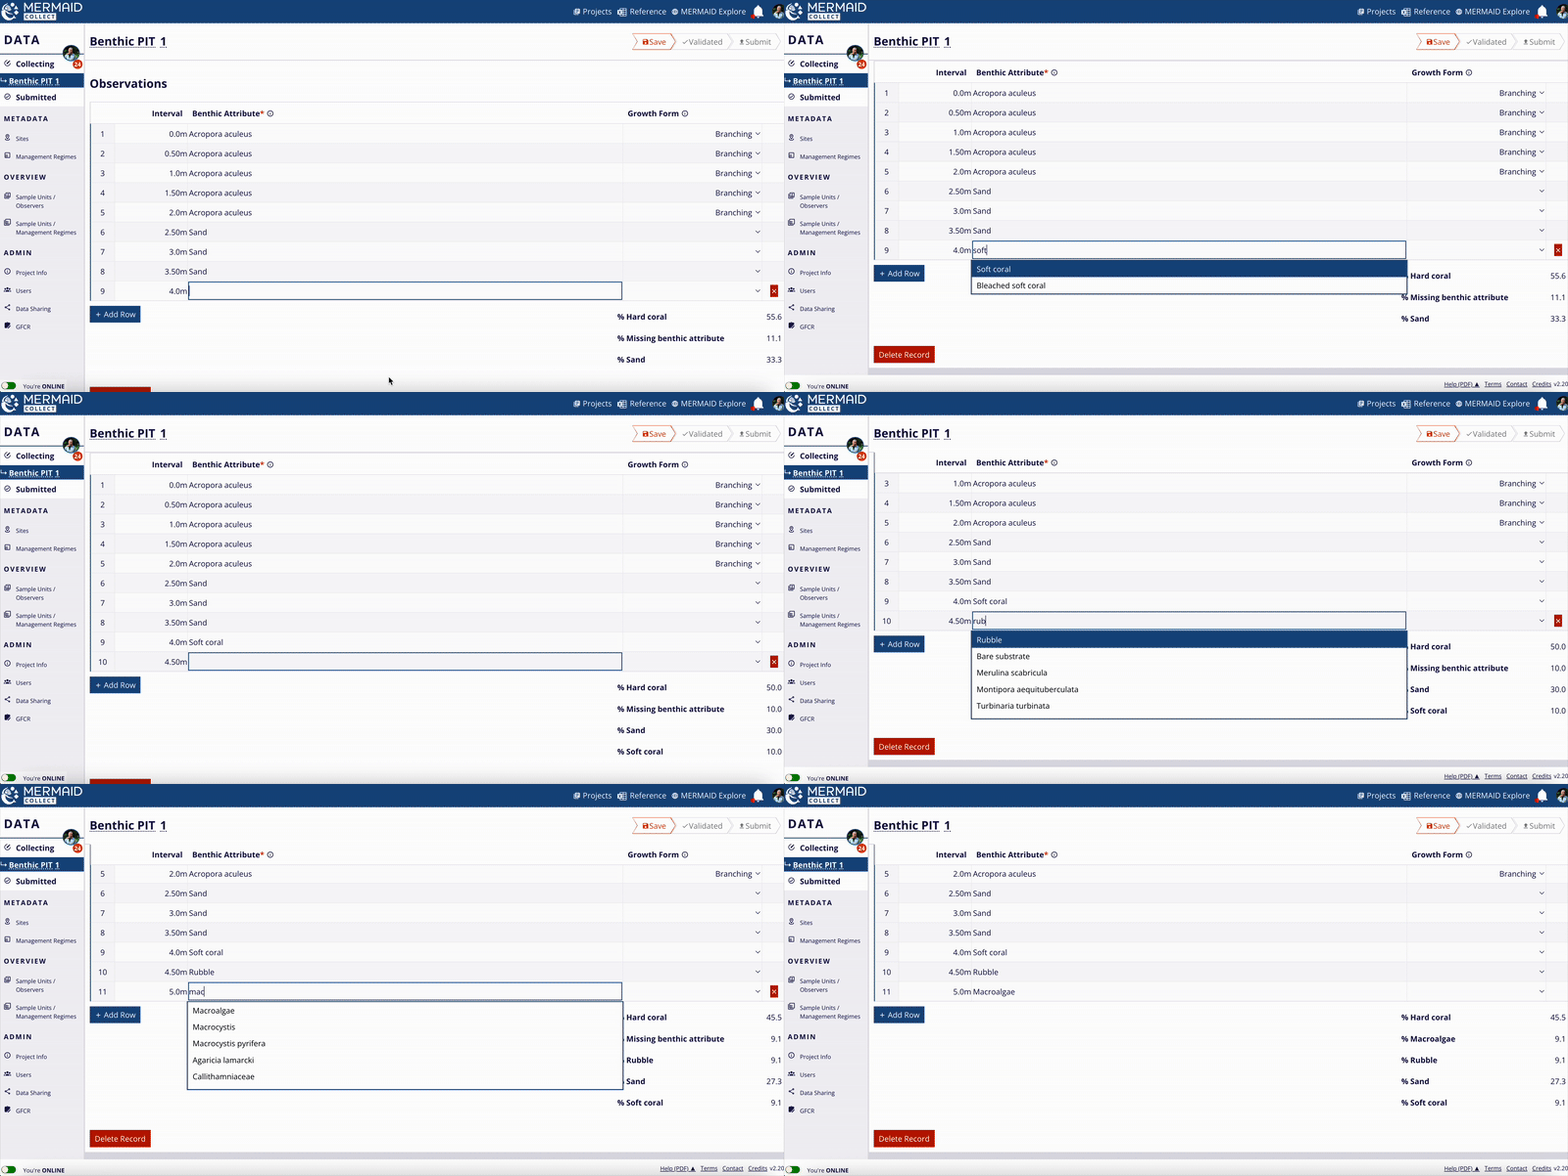
Benthic Point Intercept Transect (PIT)
Benthic Line Intercept Transect (LIT)
Benthic Photo Quadrat Transect (PQT)
All benthic observations roll up into 12 top-level benthic categories (e.g., hard coral, macroalgae, soft coral).
Percent cover calculation:
For each method, MERMAID calculates percent cover using the following formulas:

MERMAID also calculates means and standard deviations per category at the sample event level.

Bleaching severity
MERMAID includes a rapid bleaching assessment using quadrats, with bleaching categorized into seven severity categories. Data are entered into two tables:
Colonies bleached calculation:
MERMAID calculates the percentage of colonies in each of the seven bleaching severity categories (i.e., normal, pale, 0-20% bleached, 21-50% bleached, 51-80% bleached, 81-100% bleached, and recently dead) per sample unit:
Average percentage of colonies for each bleaching category per sample unit

Average percentage of colonies for each bleaching category per sample event. Standard deviations for sample events are also included

Percent cover calculation:
MERMAID calculates the average percent cover of hard coral, macroalgae, and soft coral per sample unit and sample event:
Average percentage of hard coral, macroalgae, and soft coral per sample unit. Standard deviations are also included

Average percentage of hard coral, macroalgae, and soft coral per sample event. Standard deviations are also included

Habitat complexity
MERMAID uses the Wilson et al. (2007) method for reef habitat complexity, with scores ranging from 0 (no complexity) to 5 (high complexity).
Average score calculation:
Average score per sample unit. Standard deviations are also included

Average score per sample event. Standard deviations are also included

Want to dive deeper?
For more on how MERMAID generates these metrics, including calculations and taxonomies: