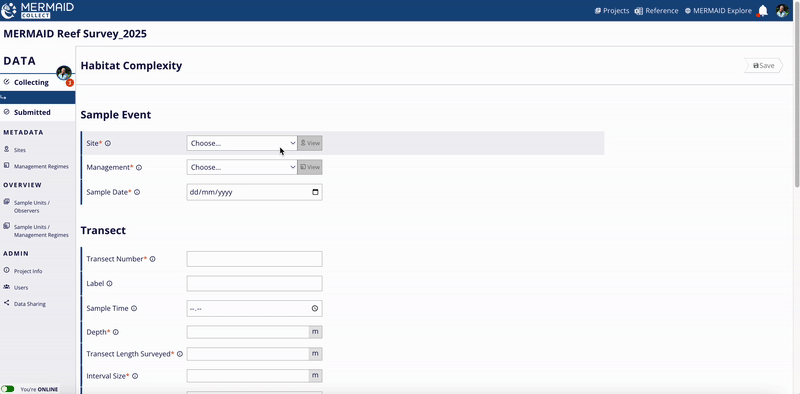
When you’re ready to enter habitat complexity data from your dive sheets, go to your project’s Collecting page and click + Add sample unit. Select the Habitat complexity method and fill out a structured form organized into four consistent sections.
This method records observations of benthic habitat complexity on a scale of 0 to 5 based on methodology proposed in Wilson et al. (2007), and described in Darling et al. (2017). A more detailed description of the method can be found in Supported Survey Methods.
Completing a habitat complexity sample unit form
Note: Required fields are marked with a red asterisk (*). These include site, management regime, observers, and key transect attributes. Optional fields include time, visibility, current, tide, and notes. Helper text is available for every field—just click the info icon next to a label to view tips, definitions, and example entries. |
1. Sample event
This section defines where and when the data was collected. You'll select:
Site – From the list of sites added to the project. Learn more about adding sites here.
Management regime – From the list of management regimes added to the project. Learn more about adding management regimes here.
Date of survey – The date the sample unit was collected.
Each sample event (site, management regime, and date) is used to group your sample units for the reef health metrics calculations in MERMAID. Read more in Learning about our reef health metrics.

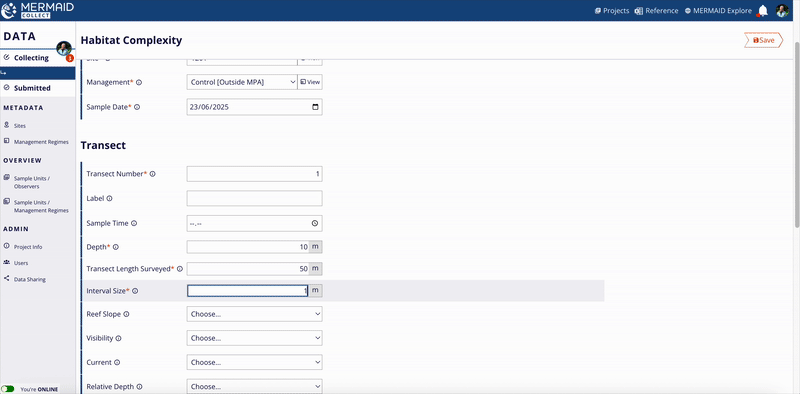
2. Transect
This section captures the protocol-specific details of the habitat complexity survey. You’ll need to fill:
Transect number
Depth (m)
Transect length surveyed (m)
Interval size (m)
Some fields use dropdowns with standardized values (e.g., reef slope, visibility, current, relative depth); others are free text or numeric fields for flexibility (e.g., depth, transect length surveyed).
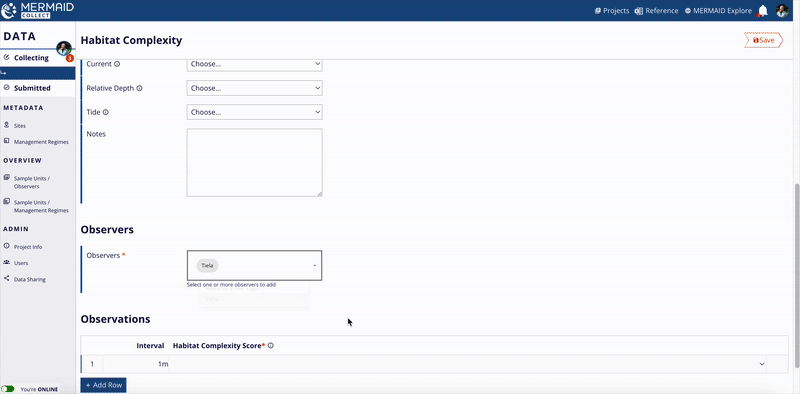
3. Observers
In this section, assign the person(s) who collected the observations underwater:
Select from the list of project users
Click to add or remove names
At least one observer is required per sample unit
Accurate attribution helps with training, reporting, and quality assurance.
4. Observations
Here’s where you enter your actual data (raw observations).
Enter the habitat complexity score for each interval. The number of rows in this table must match the number of intervals surveyed along the transect length to ensure complete data entry.
Tips for data entry: Keyboard shortcuts and predictive text
Use these keyboard shortcuts and the predictive text to move quickly through the Observations table in a sample unit form:
Use the Tab key to move across fields in a row.
Use the Up and Down arrow keys to scroll through habitat complexity score suggestions.
Click the Habitat complexity score column, then use the arrow keys and Enter/Return/Tab to select it from the dropdown options.
Press Tab at the end of a row to duplicate the observation in the next row—useful for entering multiple observations of the same complexity score in a transect.
Press Enter/Return to start a new row and begin typing the next observation.
This helps ensure consistent naming and speeds up your workflow—especially when entering lots of observations.
Metric summaries in a habitat complexity sample unit
As you enter observations in a sample unit, MERMAID automatically calculates and displays key metric summaries to provide quick insights and support data quality checks — all available even when you’re offline.
For habitat complexity surveys, MERMAID calculates the average complexity score (scale 0–5) across all intervals entered. This provides an overview of structural habitat condition for each transect and this metric summary can be viewed in the exported data file once data is submitted in the Submitted page.