Start here
Using MERMAID Collect
Using MERMAID Explore
Using MERMAID R package
Importing photo quadrat data into MERMAID
Learning about our taxonomic reference
MERMAID provides a centralized and standardized reference for all reef fish species and benthic attributes used in data collection and analysis. These references are validated against authoritative sources to ensure taxonomic accuracy and analytical consistency across the platform.
Taxonomic authority and source integration
MERMAID maintains scientific accuracy by relying on the following authoritative databases:
World Register of Marine Species (WoRMS)
All fish and benthic species names in MERMAID are checked against WoRMS to ensure they are taxonomically valid and accepted. This reduces duplication and ensures naming consistency across projects. MERMAID also uses WoRMS to retrieve geographic distributions for all benthic attributes and reef fish.FishBase
For reef fish species, MERMAID automatically retrieves and regularly updates key ecological and biological attributes from FishBase, including:Geographic distribution (combined with information from WoRMS)
Maximum length (as total length)
Trophic level
Vulnerability to fishing
Climate vulnerability score
Length-weight coefficients (a and b) used to calculate biomass using a Bayesian length-weight model
Download our taxonomic reference file
You can access the full reference list directly in MERMAID Collect, even when offline:
Open MERMAID Collect.
Click Reference in the top-right toolbar.
This will automatically download an XLSX file with the most up-to-date taxonomic references for fish and benthic attributes in MERMAID.
MERMAID’s taxonomic references are updated regularly. To ensure accuracy, always download the latest version before use.

What’s inside the Reference file
The reference file contains 5 worksheets:
Fish families
Fish genera
Fish species
Fish groupings
Benthic
Each sheet provides a standardized, filterable list of valid taxonomic entries and their metadata. These lists are used across MERMAID Collect, Explore, and R package.

Tips for using the Reference file
Use Excel filters in the Parent column:
Select (Blanks) to view only top-level categories
Select a specific parent (e.g., Acropora) to view all related attributes


Proposing new benthic attributes or fish species
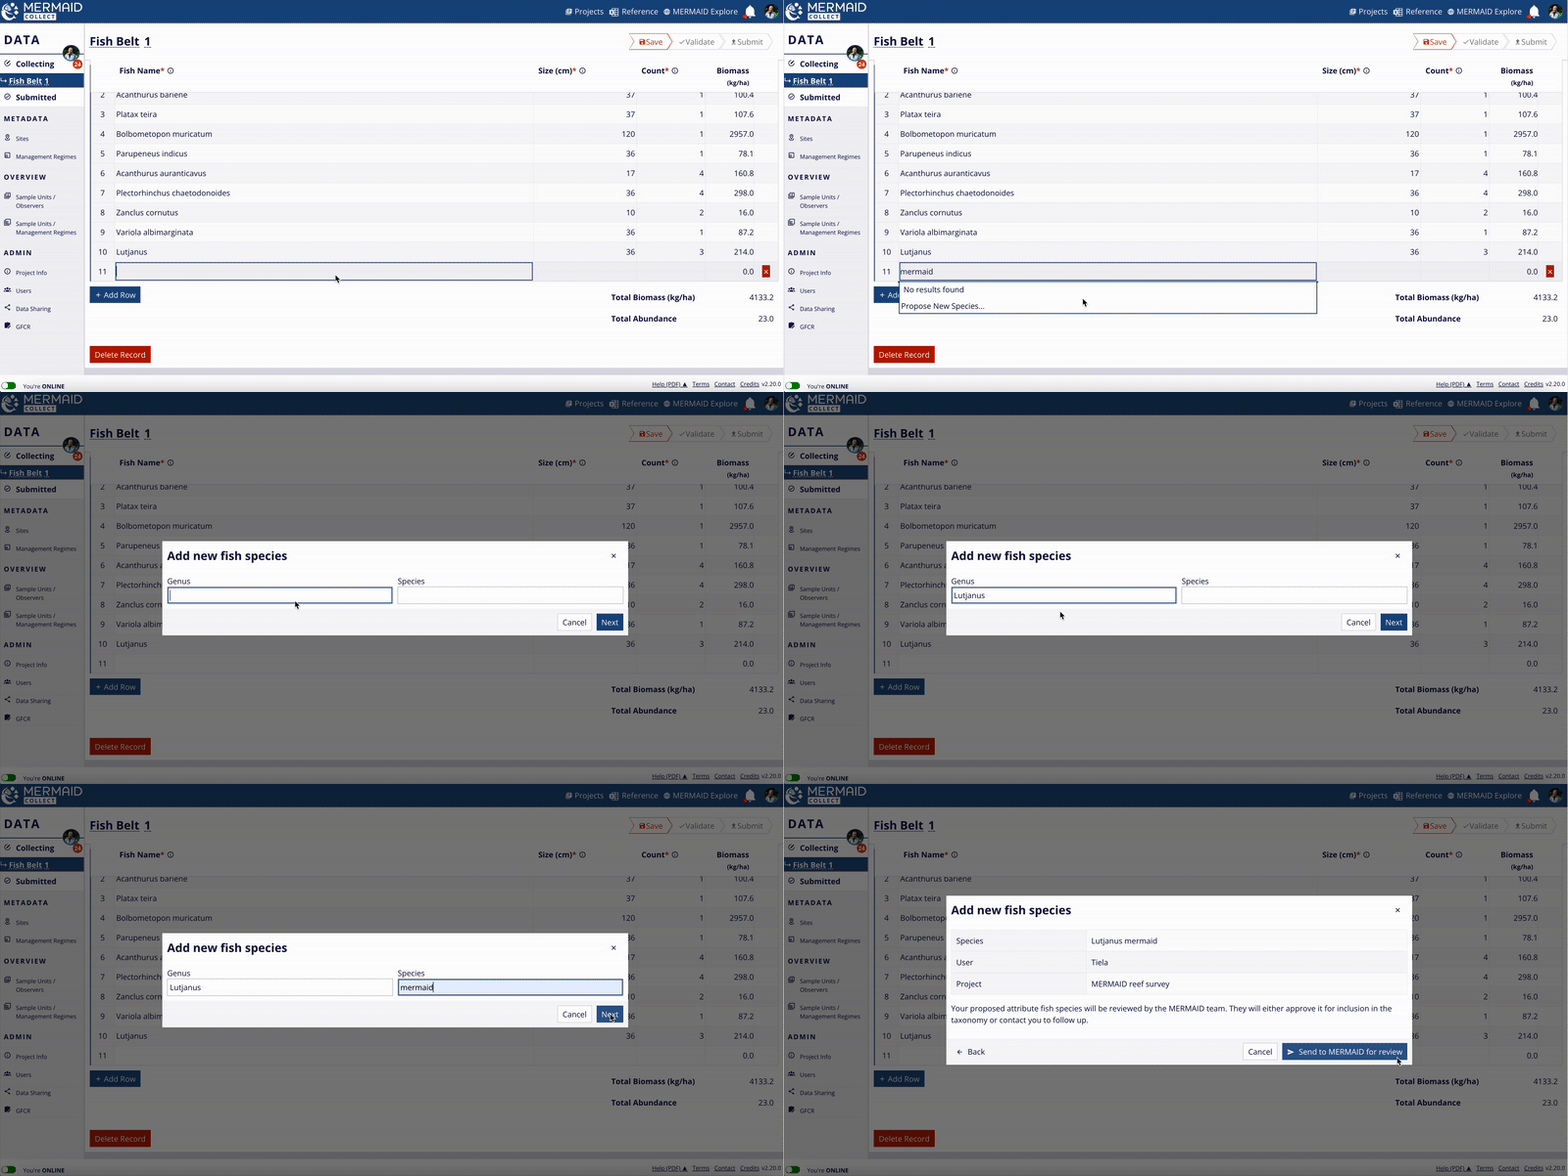
The MERMAID taxonomic reference list is continuously expanding, thanks to contributions from users across the community. When users enter observations in MERMAID Collect, they can propose new benthic attributes or fish species that are not yet in the system.
Every proposal is reviewed by the MERMAID team, who verify the name against authoritative databases like WoRMS (for taxonomy) and FishBase (for fish traits and ecological data). Once approved, new entries are added to the reference database and become available to all MERMAID users.
If you notice a species or attribute that’s missing, cross check with the WoRMS database to ensure you’re using the accepted scientific name. If the accepted scientific name is not available in MERMAID, you can easily propose it while adding your data.
Learn how to do this in Adding a sample unit to collect data.
Standard taxonomic hierarchies in MERMAID
MERMAID uses a unified hierarchy structure for fish and benthic data across all tools—Collect, Explore, and the R package mermaidr. This ensures taxonomic consistency, reduces data cleaning, and enables reproducible analysis workflows.
Fish hierarchy
MERMAID rolls up reef fish observations using the following structure:
Species → Genus → Family → Trophic group
e.g., Acanthurus achilles (species)→ Acanthurus (genus) → Acanthuridae (family) → Herbivore (trophic group)
Trophic groupings (e.g., planktivores, piscivores, herbivores) are used for functional diversity and fisheries impact analyses.
When only genus or family is reported, MERMAID uses genus/family-level values from FishBase to compute averaged constants (e.g., for biomass estimation).
Benthic hierarchy
MERMAID uses a similar structure for benthic attributes:
Species → Genus → Family → Top-level category
e.g., Acropora palmata (species) → Acropora (genus) → Acroporidae (family) → Hard coral (top-level category)
The 12 top-level benthic categories used in MERMAID are:
|
|
|
|
|
|
|
|
|
|
|
|
These categories are used to calculate benthic cover composition across sites and projects.
Why this matters for your data
These hierarchies are essential for calculating key reef health metrics such as:
Benthic percent cover
Fish biomass (kg/ha) by family and trophic group
By automatically grouping observations from species to broader ecological categories, MERMAID allows users to generate these metrics even when observations are reported at different taxonomic levels (e.g., genus or family instead of species).

Summary
All fish and benthic taxonomy in MERMAID is validated through WoRMS.
Fish data are dynamically retrieved from FishBase, including biomass and ecological traits.
Propose new species or attributes easily in-app, with validation support.
Use the reference file to explore, filter, and better understand taxonomic groupings.
MERMAID’s standardized taxonomy structure simplifies analysis and supports reproducible science.
Learning about our reef health metrics
MERMAID automatically calculates commonly used reef health metrics that are widely used in coral reef science and management. These metrics summarize your raw field observations into reef fish biomass, percent benthic cover, bleaching severity, and habitat complexity. They are available in MERMAID Collect, MERMAID Explore, as well as in the export XLSX files, and programmatically via the MERMAID R package.
Understanding the MERMAID data hierarchy
All metrics in MERMAID are structured into three levels:
Observation: Individual records (e.g., each fish count for a size class or benthic point). This is your raw data
Sample unit: One transect or survey effort (e.g., one fish belt transect)
Sample event: A site-level aggregation on a given survey date (e.g., all transects in a site on a specific date)

Accessing observations and summary data
Once your data is entered, validated, and submitted in MERMAID Collect, you can export it as a zipped XLSX file. This export file includes separate worksheets for:
Observation data (e.g., individual fish or benthic records)
Sample unit summary (e.g., averages from each transect)
Sample event summary (e.g., site-level averages for a survey date)
You can also access the same data using the mermaid_get_my_projects_data() function in the MERMAID R package mermaidr. Read more in Accessing Project Data.
Fish abundance and biomass
MERMAID calculates both total fish abundance and biomass. Abundance is calculated by summing the count of fish observed for each sample unit. Biomass is calculated using formulas based on FishBase Bayesian length-weight coefficients. MERMAID calculates:
Total biomass (kg/ha) and abundance (individu) for each sample unit
Average biomass (kg/ha) means and standard deviations by:
Sample event
Trophic group (e.g., piscivores, planktivores, herbivores)
Fish family (e.g., Scaridae, Acanthuridae)
Biomass calculation:
MERMAID calculates biomass using the following steps:
Fish biomass (kg/ha) per observation

Total fish biomass (kg/ha) per sample unit by family, and trophic group

Average biomass (kg/ha) per sample event by family, and trophic group. Standard deviations are also included

Benthic cover
MERMAID supports three benthic methods:
Benthic Point Intercept Transect (PIT)
Benthic Line Intercept Transect (LIT)
Benthic Photo Quadrat Transect (PQT)
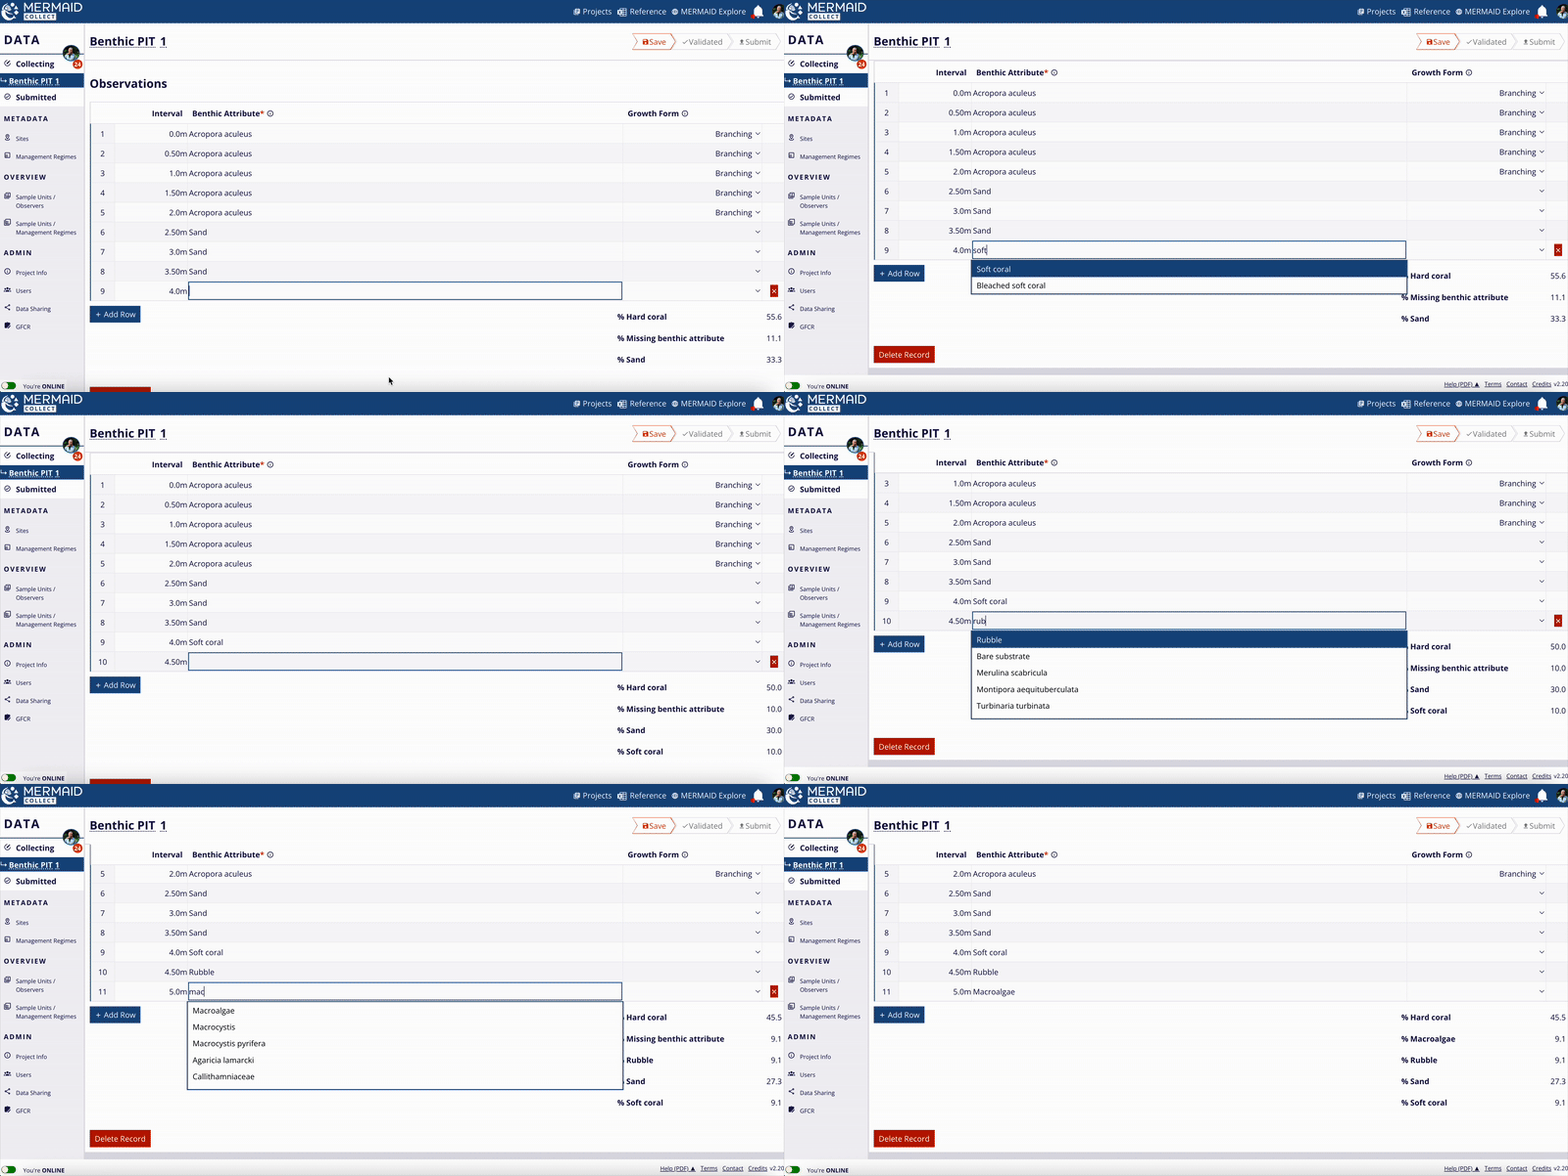
All benthic observations roll up into 12 top-level benthic categories (e.g., hard coral, macroalgae, soft coral).
Percent cover calculation:
For each method, MERMAID calculates percent cover using the following formulas:

MERMAID also calculates means and standard deviations per category at the sample event level.
Bleaching severity
MERMAID includes a rapid bleaching assessment using quadrats, with bleaching categorized into seven severity categories. Data are entered into two tables:
Colonies bleached calculation:
MERMAID calculates the percentage of colonies in each of the seven bleaching severity categories (i.e., normal, pale, 0-20% bleached, 21-50% bleached, 51-80% bleached, 81-100% bleached, and recently dead) per sample unit:
Average percentage of colonies for each bleaching category per sample unit

Average percentage of colonies for each bleaching category per sample event. Standard deviations for sample events are also included

Percent cover calculation:
MERMAID calculates the average percent cover of hard coral, macroalgae, and soft coral per sample unit and sample event:
Average percentage of hard coral, macroalgae, and soft coral per sample unit. Standard deviations are also included

Average percentage of hard coral, macroalgae, and soft coral per sample event. Standard deviations are also included

Habitat complexity
MERMAID uses the Wilson et al. (2007) method for reef habitat complexity, with scores ranging from 0 (no complexity) to 5 (high complexity).
Average score calculation:
Average score per sample unit. Standard deviations are also included

Average score per sample event. Standard deviations are also included

Want to dive deeper?
For more on how MERMAID generates these metrics, including calculations and taxonomies:
Citing data from MERMAID
Properly citing data is essential, especially when using datasets from projects you are not directly involved with. Correct citation ensures appropriate credit to data collectors and supports data transparency and reproducibility.
Project citation in MERMAID Collect
MERMAID automatically generates a suggested citation for each project. You can find this citation on the Project info page within the MERMAID Collect. It is also included in all exported data files and displayed in the Metadata section of a site view in MERMAID Explore.
Key Points:
|

Citation format
All suggested citations generated in MERMAID follow the same following format:
[Projects admins]. [Date of last update in project]. [Project name]. MERMAID. [URL to project view in MERMAID Explore]. |
How to access and edit the citation
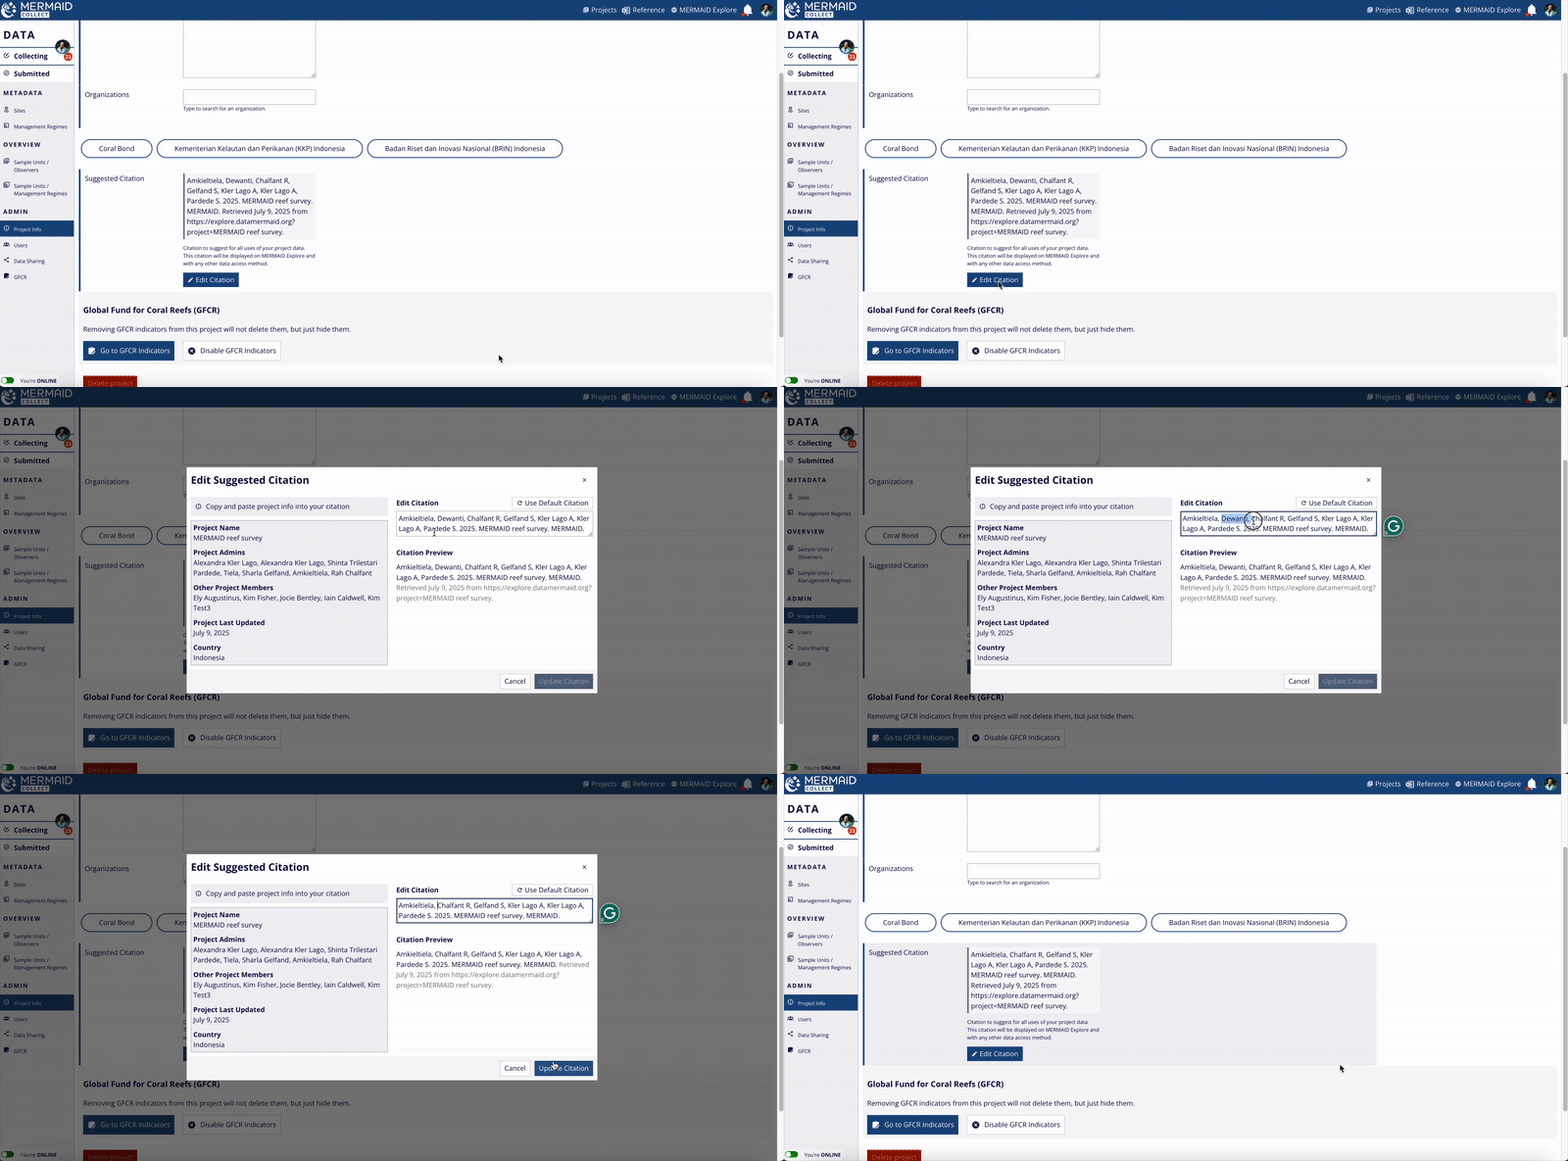
Go to the Project info page inside your project.
Click the Edit Citation button to open the editable citation modal.
Modify the citation text as needed in the Edit Citation field.
When finished, click Update Citation to save your changes.
Revert changes
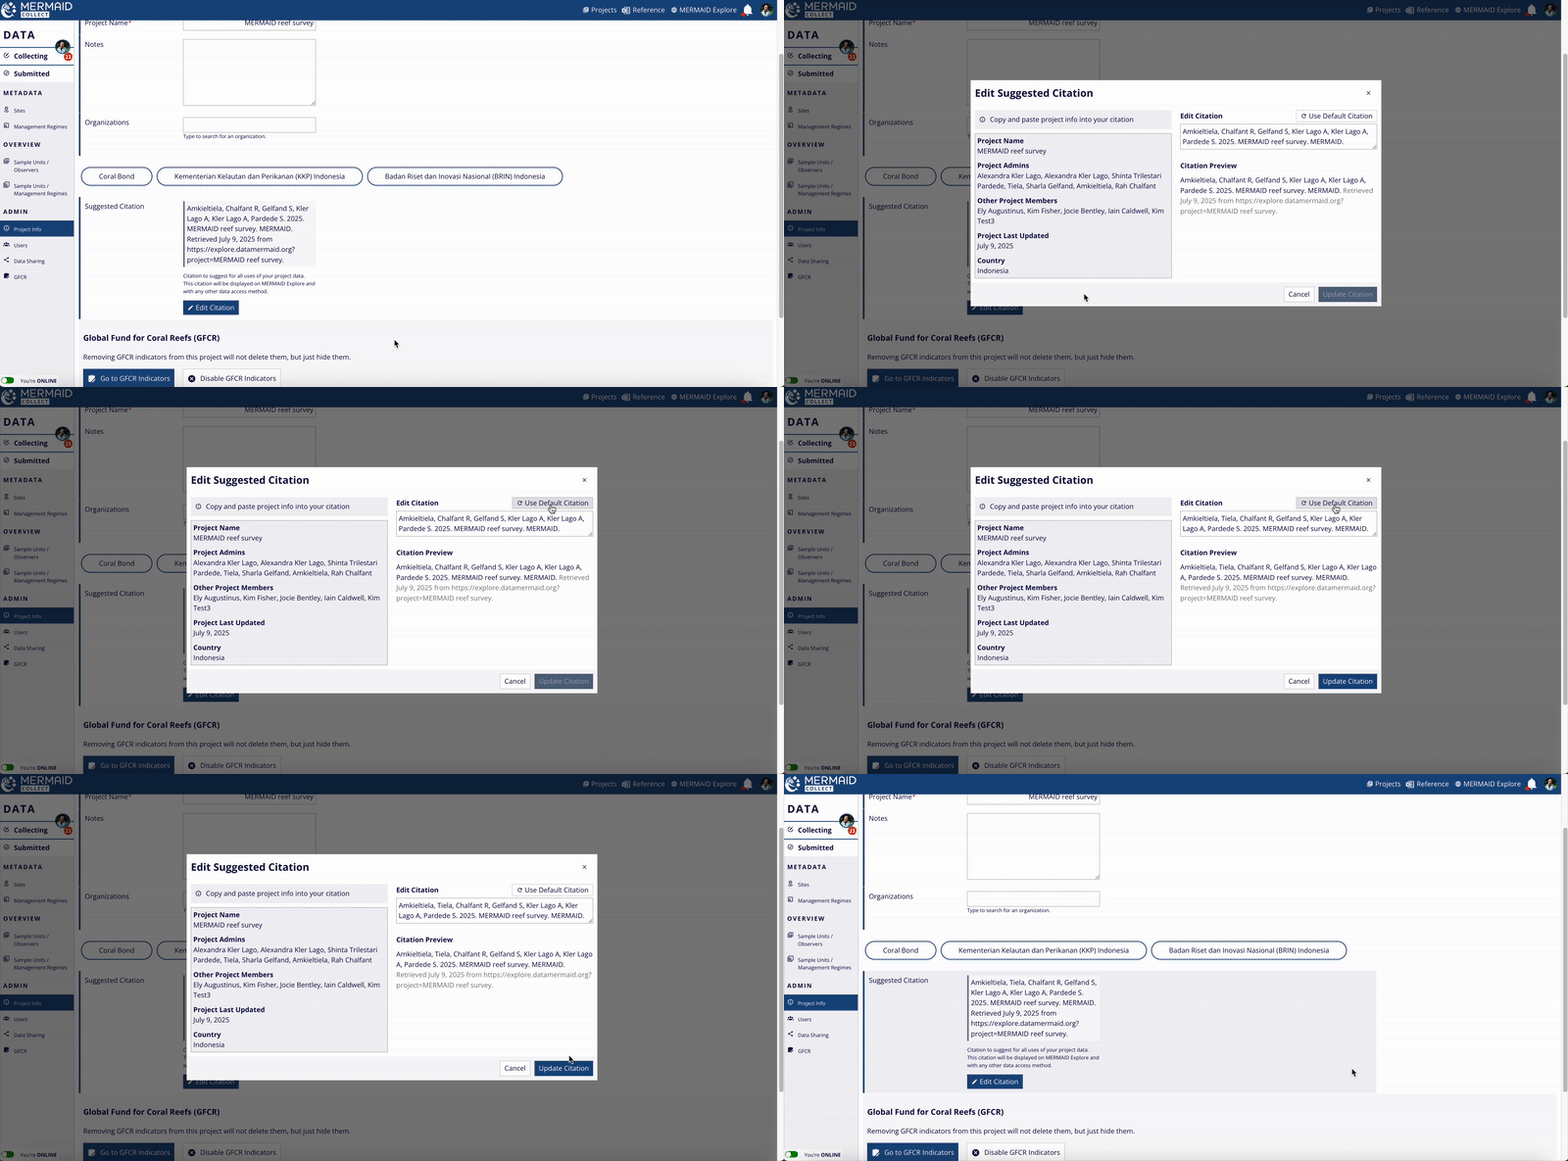
If you want to revert to MERMAID’s original suggested citation after making edits, click the Use Default Citation button located at the upper right of the Edit Citation field.
Remember to click Update Citation after reverting to ensure your choice is saved.
Viewing project citation in exported data files
The project’s suggested citation is always included in the data files exported from MERMAID. In each exported file—whether in the Sample events, Sample units, or Observations tabs—you will find a column labeled Suggested citation containing the current project citation.
This inclusion guarantees that anyone using exported data has clear guidance on how to properly cite the dataset.

Viewing project citation in MERMAID Explore
Users can also view the project’s suggested citation while exploring survey data in MERMAID Explore:
Navigate to the Survey site you want to view.
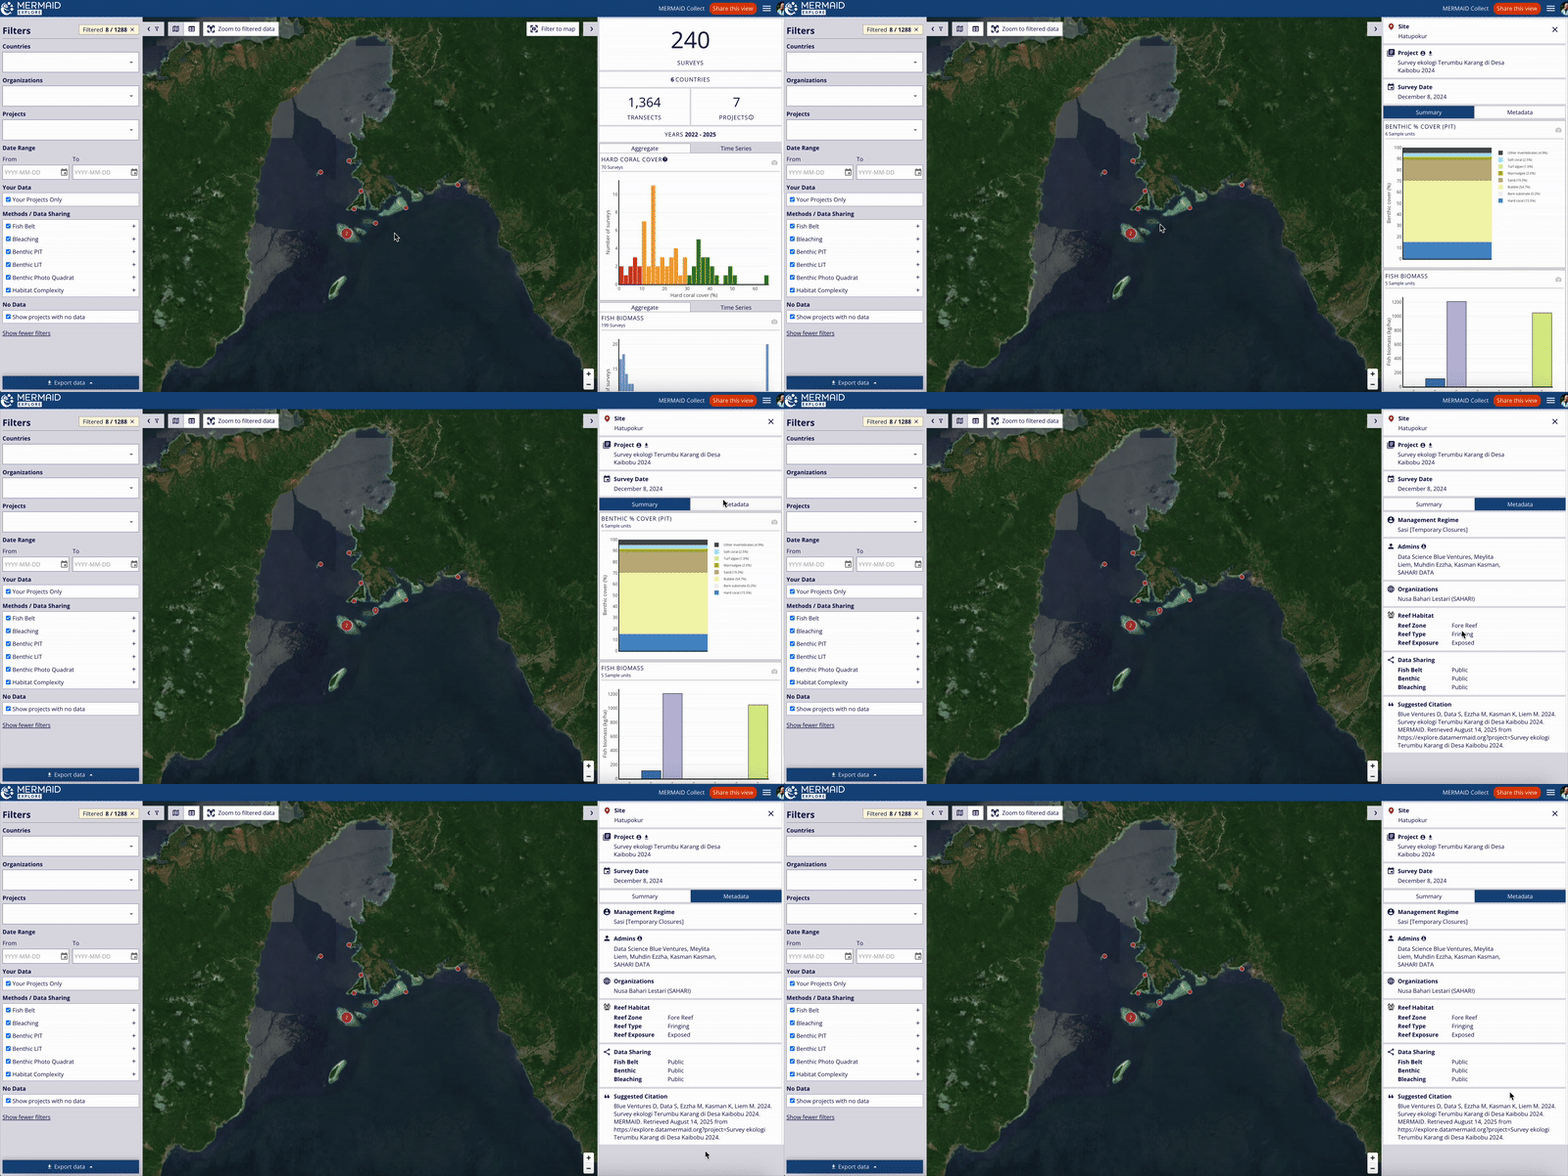
Open the Metadata tab within the site view on the right metrics panel.
Scroll to the bottom of the Metadata section to find the Suggested citation area.
The citation displayed here reflects the current project citation, as set on the Project info page in MERMAID Collect.
This feature ensures that users accessing data through MERMAID Explore can easily reference the project’s citation for proper acknowledgment.
Getting data from MERMAID (via API)
MERMAID provides programmatic access to its entire dataset via an Application Programming Interface (API). This API is the backbone of all MERMAID tools—including MERMAID Collect, MERMAID Explore, and the MERMAID R package mermaidr—and can also be used directly for building custom tools, dashboards, or workflows.
This documentation refers specifically to the production API hosted at: https://api.datamermaid.org/v1/
The API is built on a secure, scalable AWS-based stack, powered by a PostgreSQL database (via Amazon RDS) and developed using Django and the Django REST Framework.
It is actively used by:
All MERMAID code is free and open source, licensed to support transparency, reproducibility, and community-driven development.
Why use the API?
Use the MERMAID API if you want to:
Automate data exports and processing.
Access real-time, up-to-date MERMAID data without manual exports.
Build your own custom visualizations or apps using MERMAID data.
Integrate MERMAID data into third-party software (e.g., ArcGIS, R Shiny, Tableau)
Explore the API Docs
You can find a detailed API documentation, which includes:
A client file guide using Insomnia to test requests
Instructions for authentication using MERMAID login credentials
Resources to browse endpoints
Authentication
All API requests require authentication. You can either:
Use your MERMAID credentials to obtain a token
Or generate an API token (if available to your user type)
Common endpoints for MERMAID projects
Here are some frequently used endpoints related to MERMAID projects:
Observations: All observation in a transect for each survey method:
/projects/<project_id>/obstransectbeltfishs/
/projects/<project_id>/obsbenthiclits/
/projects/<project_id>/obsbenthicpits/
/projects/<project_id>/obscoloniesbleached/
/projects/<project_id>/obsquadratbenthicpercent/
/projects/<project_id>/obshabitatcomplexities/
Sample units: Aggregated metrics at the transect-level for each survey type:
/projects/<project_id>fishbelttransects
/projects/<project_id>/benthictransects/
/projects/<project_id>/quadratcollections/
Sample events: Aggregated metrics at the site/date-level for all survey types:
/projects/<project_id>/sampleevents/
Integration examples
You can use the API in tools such as:
R: via
httr,jsonlite, ormermaidrPython: using
requestsorpandasWeb apps: JavaScript
fetch()or client-side libraries
Learn from our users
How Rare automates data from MERMAID to their dashboard
A standout example of how the MERMAID API is being used comes from Rare, which built an automated pipeline to extract coral reef monitoring data from its Fish Forever projects in MERMAID and feed it directly into their internal dashboard for streamlined analysis and reporting.
What it does:
Extracts data from the MERMAID API for projects tagged with “Rare,” including fish, coral, and photo quadrat data.
Transforms raw data into standardized formats using Python and Pandas, with full data validation.
Loads processed data into a PostgreSQL database, enabling real-time analytics and dashboarding.
Technologies used:
Apache Airflow: for robust, scheduled orchestration (daily at 2 AM)
Python with Pandas: for data transformation
SQLAlchemy: for secure and efficient database communication
Benefits:
Eliminates manual data downloads and prep
Keeps data fresh and analysis-ready with daily updates
Ensures consistency, error handling, and logging across projects
Scales across multiple projects and supports parallel processing
This pipeline is a powerful demonstration of how MERMAID’s API can be used to support data workflows.
This pipeline is available on GitHub, allowing other organizations to adopt or customize it for their own needs.
Related Resources
Need help getting started? Contact the MERMAID support team or explore the API docs to learn more.