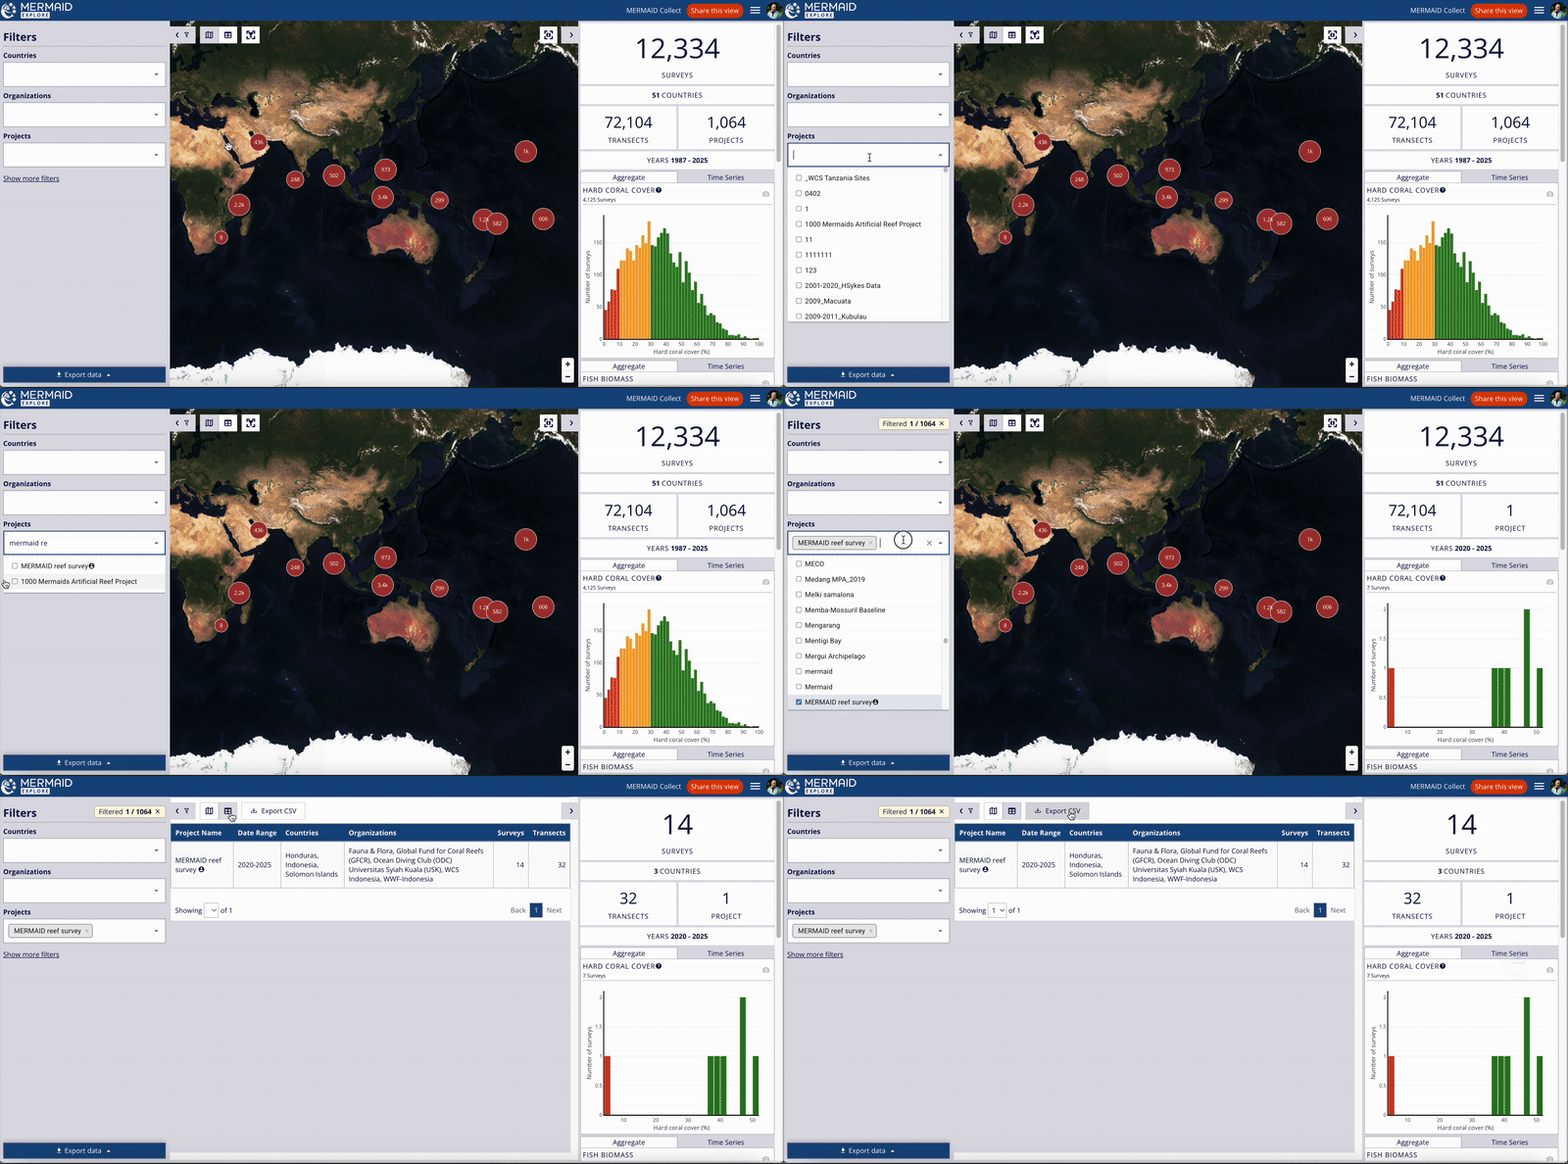
For a tabular summary of your filtered data:
Apply your desired filters.
Click the Table View button (looks like a table icon) at the top left of the map.
The table displays summary information (Project Name, Dates, Countries, Organizations, Survey/Transect counts) for the filtered projects.
To export this summary table, click Export CSV at the top of the table.
Switch back anytime using the Map View button (looks like a map icon
 ).
).

Switch to Table View to see a summary of filtered projects and export it as a CSV.